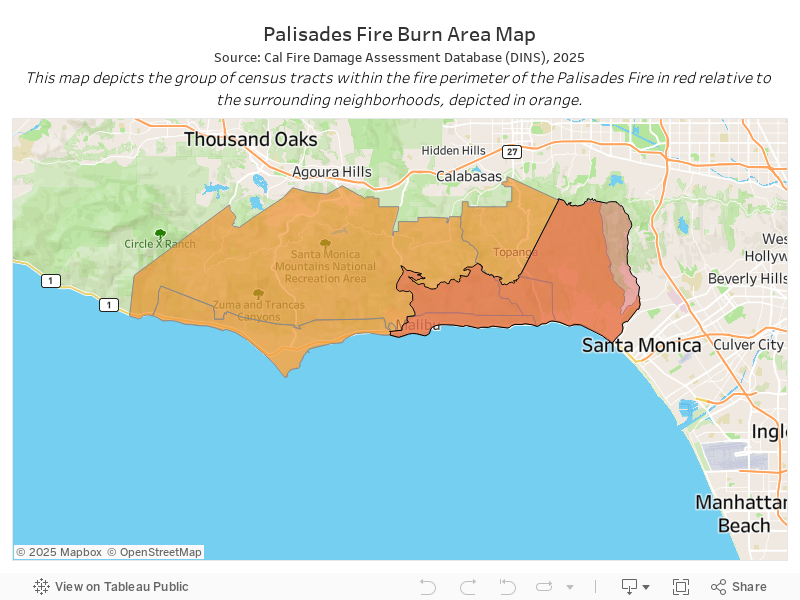
Demography
The data below is intended to summarize key demographic components of the Palisades Fire burn area.
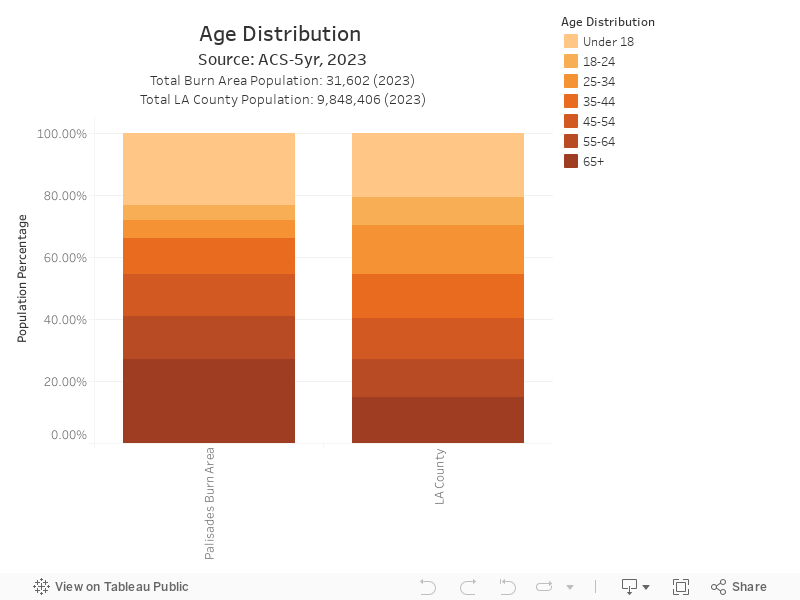
31,602
27%
16%
2.49
(ACS 5-yr, 2023)
(ACS 5-yr, 2023)
(ACS 5-yr, 2023)
(ACS 5-yr, 2023)
Housing & Real Estate
The data below is intended to summarize the housing and real estate landscape of the Palisades Fire burn area.
$3,134
(ACS 5-yr, 2023)
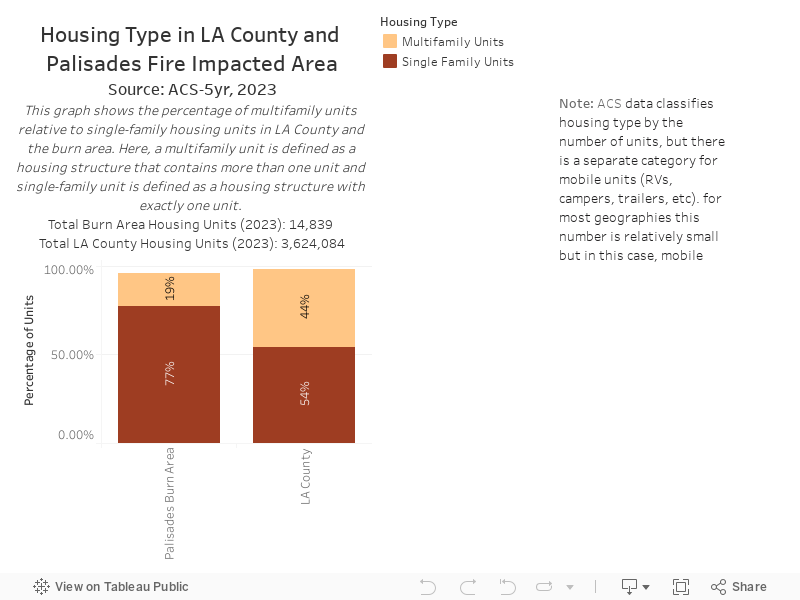
48%
(ACS 5-yr, 2023)
22%
(ACS 5-yr, 2023)
19%
(ACS 5-yr, 2023)
Health & Environment
The data below is intended to summarize key health and environmental indicators across the Palisades Fire burn area.
81st
(FEMA, 2023)
39%
(NAIP, 2022)
84 y/o
Life Expectancy
(National Center for Health Statistics, 2015)
51%
(CURes at LMU, 2016)
Employment & Income
The data below is intended to summarize key employment and income indicators across the Palisades Fire burn area.
$195,813
(ACS 5-yr, 2023)
6%
(ACS 5-yr, 2022)
4%
(ACS 5-yr, 2023)
6%
(ACS 5-yr, 2023)
Explore more indicators for the impacted areas on the NDSC map below.
If you are in need of support, we encourage you to utilize the resource directory from Los Angeles County Recovers.
Authors & Contributors

Justin Culetu
Justin is a first-year Master of Public Policy Student at the Price School of Public Policy. He studied at the University of California, San Diego where he earned his Bachelor’s Degree in Law/Political Science as a student-athlete on the men’s NCAA Division 1 swim team. His policy interests are Homeland Security and Congressional Oversight.

Emily Phillips
Emily (she/her) is the Project Specialist at Neighborhood Data for Social Change. Emily received her Master in Public Policy with a specialization in advocacy communications from the USC Price School in the Spring of 2024. Prior to relocating to Southern California, Emily grew up in Phoenix and then obtained her BA in Political Science and Global Studies from Loyola University Chicago. Her main focus incudes policy advocacy across a variety of policy areas including housing, health, and racial justice. She is passionate about community engagement and social impact.
Other contributors include: Elly Schoen, Cameron Yap & Ben Regev
Authors & Contributors
Justin Culetu
Justin is a first-year Master of Public Policy Student at the Price School of Public Policy. He studied at the University of California, San Diego where he earned his Bachelor’s Degree in Law/Political Science as a student-athlete on the men’s NCAA Division 1 swim team. His policy interests are Homeland Security and Congressional Oversight.
Emily Phillips
Emily (she/her) is the Project Specialist at Neighborhood Data for Social Change. Emily received her Master in Public Policy with a specialization in advocacy communications from the USC Price School in the Spring of 2024. Prior to relocating to Southern California, Emily grew up in Phoenix and then obtained her BA in Political Science and Global Studies from Loyola University Chicago. Her main focus incudes policy advocacy across a variety of policy areas including housing, health, and racial justice. She is passionate about community engagement and social impact.
Other contributors include: Elly Schoen, Cameron Yap & Ben Regev
