Table of Contents
Key Insights
- Since the 1980s, the gap between rents and renter incomes in Los Angeles County has widened, with rent burden rates consistently exceeding national averages for more than four decades.
- Since 2010, median renter incomes have grown faster than rents, but rent burden remains high—especially among lower-income households.
- Rent burden has declined most among Hispanic/Latino renters over the last decade, while Black renters continue to face the highest cost burdens.
- A growing share of older adult renters in Los Angeles County are facing severe affordability pressures.
Across the nation, rental unaffordability is reaching record highs, and Los Angeles County stands out as one of the least affordable markets. In 2023, 58% of renters in the county spent more than a third of their income on housing, compared to 52% of renters nationally. Among the ten largest U.S. metro areas, only Miami ranks worse on this measure (2025 State of the Nation Housing). High housing costs strain households across the income spectrum, but fall hardest on those with the fewest resources. For decades, rents have outpaced incomes for many Angelenos, leaving a majority paying more than they can afford for housing.
This chapter traces how renter affordability in Los Angeles County has changed over time, from the widening gap between rents and incomes in the 1980s to more recent shifts in the renter population. It examines how cost burdens vary by income, race and ethnicity, and age—and highlights the groups facing the steepest rental affordability challenges. Readers will come away with a clearer understanding of why affordability remains such a persistent problem, and who is most affected by it today.
Decades of Growing Affordability Gaps
In 1980, Los Angeles was just slightly less affordable than the national average. In today’s dollars, median rents1 were about $140 (14%) more expensive here than the national average, and median renter incomes2 were approximately $4,200 (9%) higher than the nation. In that year, 42% of Los Angeles households were rent burdened compared to 38% of renters nationwide. During the 1980s, Los Angeles experienced a large increase in population that outpaced growth in the housing supply (see Housing Supply chapter). By 1990, median rents in Los Angeles County were nearly $450 (40%) more expensive than the national average despite the fact that median renter incomes were only 25% higher than the rest of the nation.
While rent pressures eased slightly in the early 2000s, the rental market in Los Angeles County never fully recovered from the affordability crisis of the 1990s. This persistent strain on renters has been compounded by a series of major economic shocks in the 21st century, which intensified housing insecurity for low- and moderate-income Angelenos. During the Great Recession3 , real renter incomes fell to their lowest levels since 1980, even as real rents climbed to record highs. In its immediate aftermath, 59% of county renters were rent burdened, and a third were severely rent burdened—paying over half of their income on rent and utilities. These figures exceeded national averages at the time, when 53% of renters were cost burdened and 27% were severely burdened. In the dashboard below, explore how rents, incomes and rent burdens have changed in both Los Angeles County and across the U.S. since 1980 (all dollar figures are shown in 2023 dollars).
Between 2011 and 2019, real median renter incomes in Los Angeles County finally began to outpace the growth in real median rents for the first time in four decades—a rare shift that brought modest relief after years of rising housing costs. Still, rent burden in Los Angeles County declined more slowly than the national average, underscoring the region’s persistently high housing costs and limited progress on affordability. The onset of the COVID-19 pandemic and its economic fallout quickly erased those modest gains, driving rent burden rates back up to levels nearing the Great Recession in Los Angeles County and across the nation. The following section explores why affordability has remained a challenge for so many renters over the last decade, and which groups in Los Angeles County are most affected by high cost burdens.
The Current Picture of Renter Affordability
During the most recent decade, median renter incomes in Los Angeles County grew faster than median rents—a reversal of the longstanding trend of stagnant incomes and rising housing costs. At first glance, this shift suggests improved conditions for renters, but the full picture is more complex. The increase in median renter income likely reflects both rising incomes among existing renters and a growing share of high-income households entering the Los Angeles rental market.
Between 2011 and 2023, the share of renter households earning less than $50,000 (adjusted for inflation to 2023 dollars)4 declined from 50% to 38%. This could indicate that some renters have experienced income gains over time. However, the most significant growth occurred at the top of the income distribution: the share of renter households earning over $150,000 grew from 8% to 15%, making it the fastest growing income group. While this may partly reflect upward mobility among existing renters, it also signals a shifting rental landscape—one increasingly shaped by high-income households who, in earlier periods, may have transitioned into homeownership but are now staying in the rental market due to today’s housing conditions. See the changing income composition of renters in the chart below.
As homeownership becomes increasingly out of reach for Angelenos across the income spectrum (see Homeownership chapter), even the highest income households are renting longer or by choice. Additionally, Los Angeles County is attracting more renter households from outside the region. In 2023, an estimated 80,000 renter households had moved to the county within the past year—up from 59,000 in 2010. These newly arrived renters are also more likely to be high-income: nearly one in four had household incomes above $150,000 in 2023, compared to just 13% in 2010.
Despite the growth in high-income renters, households earning less than $50,000 still make up the largest share of the renter population—38% in 2023. Yet just 18% of the current rental housing stock costs $1,250/month or less, an amount that would be considered affordable to households with incomes under $50,0005. The chart below compares the distribution of renter household incomes in 2023 to the share of rental units priced at levels considered affordable for each income group, highlighting the mismatch between what renters earn and what’s available in the rental housing stock.
Rent Burden Tops 90% for Lower Income Households
This mismatch between income and available affordable housing helps explain the persistently high rent burden rates among the county’s lowest-income renters. In 2023, more than 90% of the county’s 734,000 renter households earning less than $50,000 were rent burdened. By comparison, 58% of renters earning between $50,000 and $100,000 and 22% of those earning between $100,000 and $150,000 were rent burdened. Over the past decade, rent burden rates have risen across all income groups except the lowest, who were already experiencing high rent burdens exceeding 90%.
Unlike rent burden, severe rent burden is concentrated almost entirely among households making less than $50,000. In 2023, 69% of renters in this group were severely rent burdened, compared to just 13% of households in the next highest income bracket. Among renters making less than $50,000, severe rent burden has increased steadily, rising from 63% in 2011 to 69% in 2023. Although less common, severe rent burden has also nearly doubled among renters earning between $50,000 and $99,000 during this same period.
The chart below shows the share of Los Angeles County renters in each income group that were rent burdened and severely rent burdened in 2011 and 2023.
Declining Cost Burdens for Hispanic/Latino Renters
Income alone doesn’t tell the full story. Rent burden patterns also vary sharply by race and ethnicity, reflecting longstanding structural inequities in Los Angeles County’s housing landscape.
Rent burden and severe rent burden rates have been falling among Hispanic/Latino households faster than for any other racial or ethnic group.6 In 2023, 57% of Hispanic/Latino renters were rent burdened, down from 64% in 2011.
These improvements align with strong income growth among Hispanic/Latino renter households. Between 2011 and 2023, the median income for this group rose from $44,700 to $62,000—a 39% increase, the largest of any racial/ethnic group. The chart below shows median renter income by race/ethnicity of the head of household in 2011 and 2023.
Black Renters Face the Highest Housing Cost Burdens
As the figure above shows, Black renters continue to have the lowest median incomes in the county. In 2023, 65% of Black renter households were rent burdened —the highest rates of any racial or ethnic group by a wide margin. By comparison, 55% of Asian/Pacific Islander households were rent burdened along with 56% of White renters and 57% of Hispanic/Latino renters.
Trends in severe rent burden—a more extreme measure of housing insecurity—reveal a deeper pattern. In 2011, Black households were already experiencing the highest levels of severe rent burden in the county. Similar to Hispanic/Latino renters, Black households saw a decline in severe rent burden between 2011 and 2019—from 41% to 35%. But unlike Hispanic/Latino renters, who were able to maintain those lower levels of cost burden through the pandemic, Black households saw those gains unravel. By 2023, severe rent burden among Black households had climbed back to 37%. The chart below shows rent burden and severe rent burden rates by race/ethnicity of the head of household in 2011, 2019 and 2023.
Severe rent burden increased for most groups after the pandemic, but the reversal was most pronounced for Black renters, who had been making steady gains in the pre-pandemic years. This setback reflects the enduring consequences of structural inequities: communities that start out with fewer resources are hit hardest when crisis strikes. In a region where housing affordability remains precarious even in stable times, Black households continue to face the steepest and most persistent cost burdens.
Two-thirds of Older Adult Renters are Cost Burdened
Another group particularly vulnerable to affordability pressures is older adult renters, who are more likely to live on fixed or limited incomes and face growing challenges in the Los Angeles rental market.7 As the Baby Boomer generation continues to age into retirement, the number of older adults in Los Angeles County is on the rise (see Population Characteristics chapter). While nearly two-thirds of households headed by individuals over the age of 62 in the county are homeowners—many of whom own their homes outright and have relatively lower housing costs—the growing number of older renters8 faces a much more precarious housing landscape.
In 2023, 382,300 older adult–headed households in Los Angeles County were renting their homes—an increase of nearly 127,000 households since 2010. Furthermore, two-thirds of older adult renters were rent burdened and 41% were severely rent burdened in 2023. These high levels of housing cost burden among older renters are contributing to a growing crisis of older adults experiencing homelessness—a trend examined in greater detail in the Houseless Angelenos chapter.
Contributors
- Authors
- Elly Schoen, USC Lusk Center for Real Estate
- Jared N. Schachner, USC Price School of Public Policy
- Research Team
- Cameron Yap, USC Lusk Center for Real Estate
- Devyani Ramamoorthy, USC Lusk Center for Real Estate
- Justin Culetu, USC Lusk Center for Real Estate
- Elinor Amir-Lobel, USC Lusk Center for Real Estate
- Rediet Retta, USC Lusk Center for Real Estate
- Caroline Ghanbary, USC Lusk Center for Real Estate
- Nicole Ouyang, USC Lusk Center for Real Estate
- Daiqi He, USC Lusk Center for Real Estate
Citations
Joint Center for Housing Studies of Harvard University. (2025). The State of the Nation’s Housing 2025. Link
Footnotes
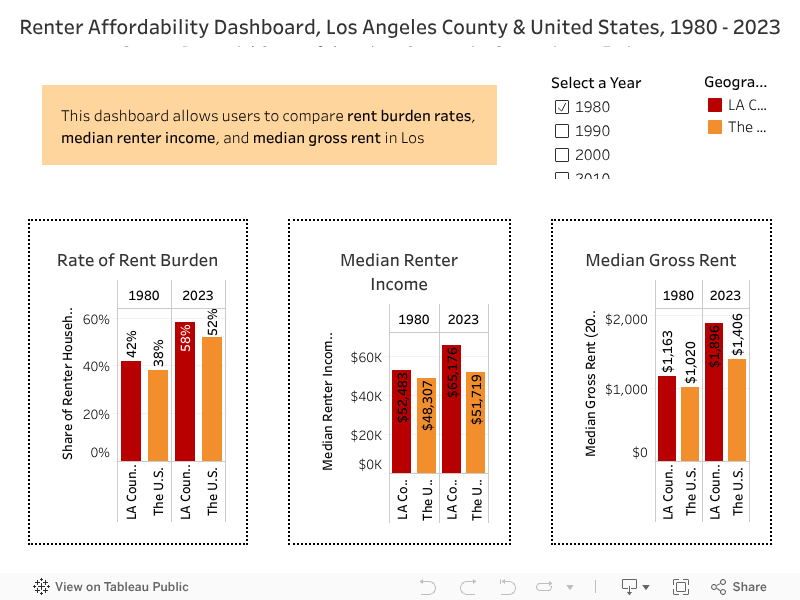
- Median rent throughout this chapter is measured as gross rent, which includes rent price plus the cost of utilities like electricity, water, gas, and sewage.
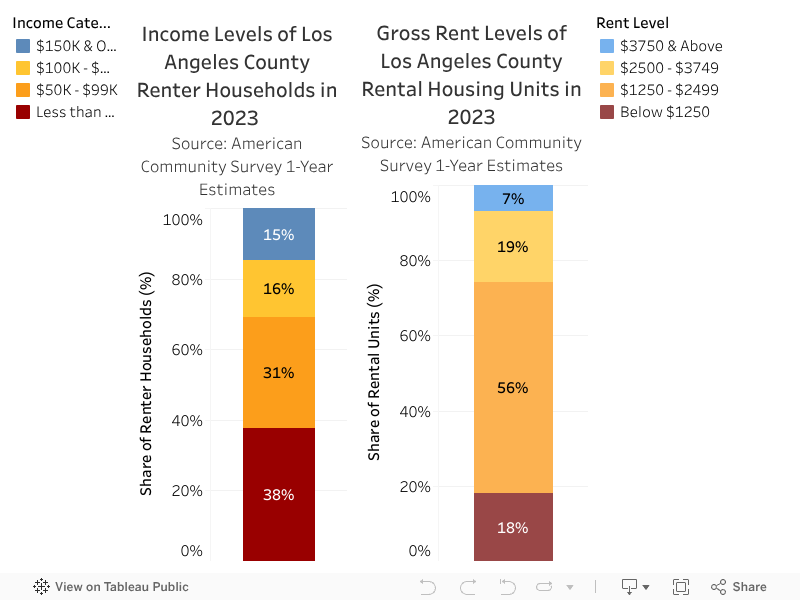
- Household income is calculated by adding the individual income of the head of a household and the incomes of all other inhabitants above 15 years of age, regardless of their relation to the head of the household. Income is defined as any money that a person earns from work, selling products or services, or any other streams such as Social Security payments, pensions, child support, public assistance, annuities, money derived from rental properties, interest and dividends, etc.
- The Great Recession refers to the global economic downturn that began in December 2007 and lasted until June 2009. It was the most severe financial crisis since the Great Depression of the 1930s, triggered by the collapse of the housing bubble and the subsequent banking and financial crisis. The housing market crash, particularly the subprime mortgage crisis, led to widespread foreclosures, massive job losses, and a sharp decline in consumer wealth, severely impacting both the U.S. and global economies.
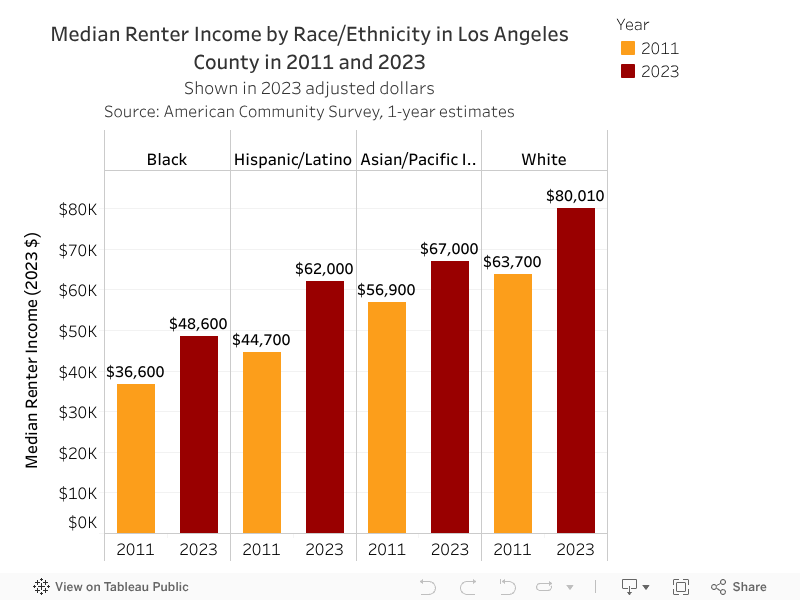
- “Adjusting for inflation to 2023 dollars” means using an inflation index, such as the Consumer Price Index (CPI), to account for changes in the purchasing power of money over time. This adjustment allows for a more accurate comparison of values from different years by expressing them in terms of the same dollar value.
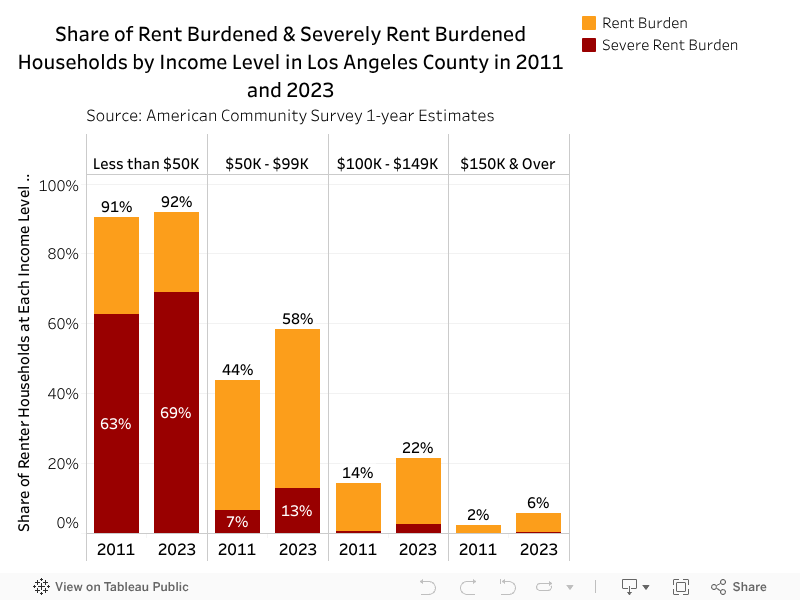
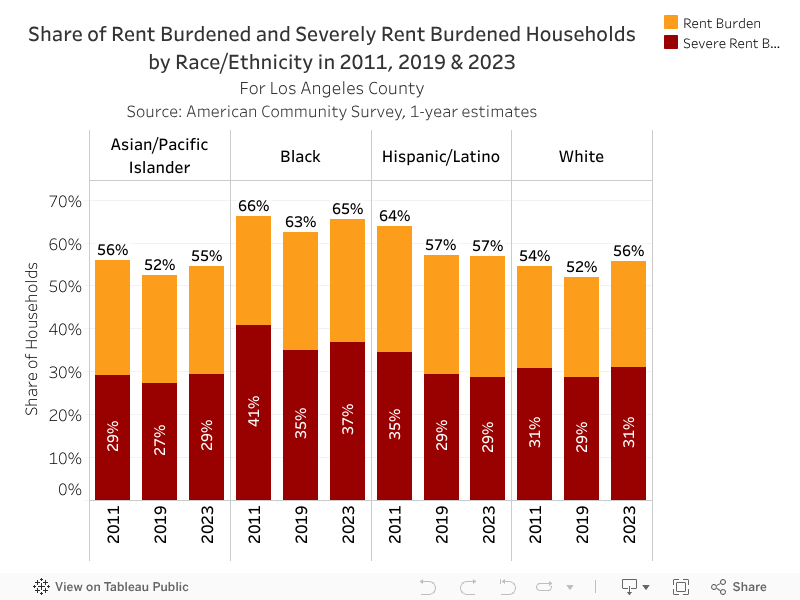
- Rent is considered affordable if a household pays no more than 30% of their income towards rent and utilities.
The race/ethnicity of a household is determined by how the head of household (the person whose name is first on the lease or mortgage) defines their own race/ethnicity. Therefore, this definition of race/ethnicity at the household level may not correctly identify all household members in interracial households
- Income includes other streams outside of wages such as Social Security payments, pensions, child support, public assistance, annuities, money derived from rental properties, interest and dividends, etc
- The “age of a household” is determined by the age of the head of household (the person whose name is first on the lease or mortgage).