Table of Contents
Key Insights
- Homeownership rates in Los Angeles County are at a 53-year low.
- Current homeowners remain in their homes for longer periods, leading to less turnover of the existing supply.
- Over the last decade, homeownership rates have fallen across all income groups, but middle-income households have experienced the steepest declines.
- Between 2010 and 2023, homeownership rates among Black households fell, widening existing gaps across racial/ethnic groups. Only Asian/Pacific Islander households saw increases in homeownership.
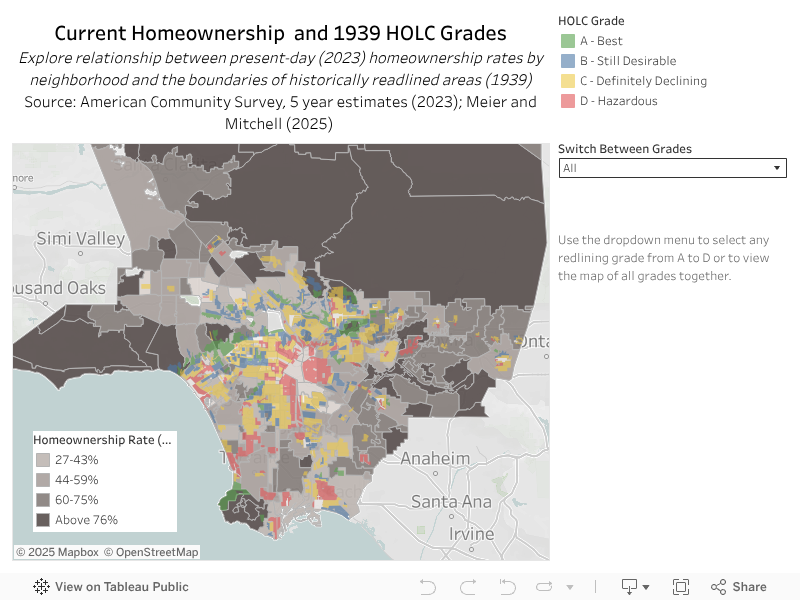
- Homeownership rates in redlined communities remain well below the countywide average in 2023.
Homeownership remains a critical measure of economic stability and wealth-building, but in Los Angeles County, access to homeownership has become increasingly elusive for many households. As of 2023, homeownership rates in the county are at a 53-year low, with significant disparities observed across household income and race/ethnicity, as well as by neighborhoods, based on their history of credit access and racial exclusion. This chapter examines the key factors contributing to low homeownership rates in Los Angeles County, including rising home values, limited housing supply, and historical policies that have shaped the current housing landscape. Readers will gain a clearer understanding of the forces driving the decline in homeownership and the communities most affected by it.
Understanding Los Angeles County’s Low Homeownership Rates
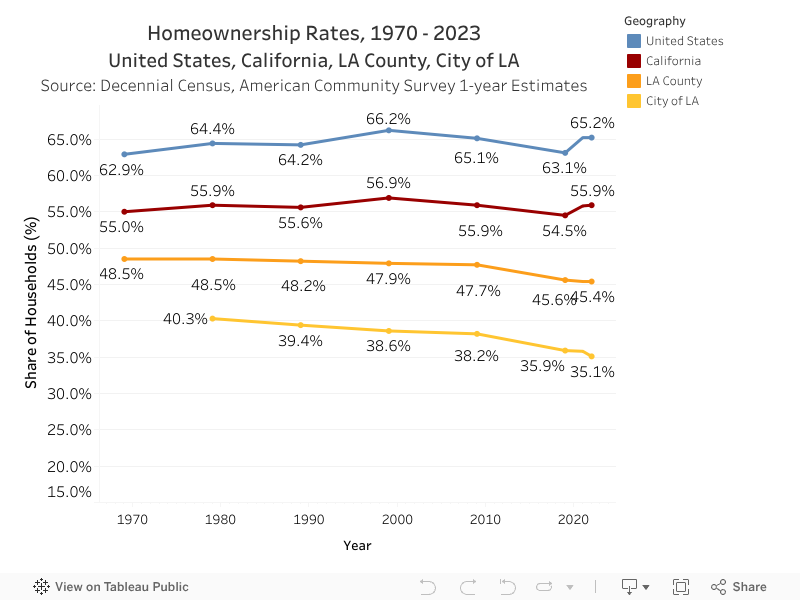
As shown in the chart below, since 1970, homeownership rates in Los Angeles County have consistently been lower than both the state and national averages. In 2023, the gap in homeownership between Los Angeles County and both the state and national averages is wider than it has been in over 50 years. In Los Angeles County, 45% of households own the home they live in, compared to 56% of California households and 65% nationwide. Both LA County and the City of LA have seen declines in homeownership rates since 1980, with the steepest decline occurring in the most recent decade. By comparison, homeownership rates across California and the U.S. also fell between 2000 and 2020, but began rising again in the past several years.
Home Values Far Outpace Incomes
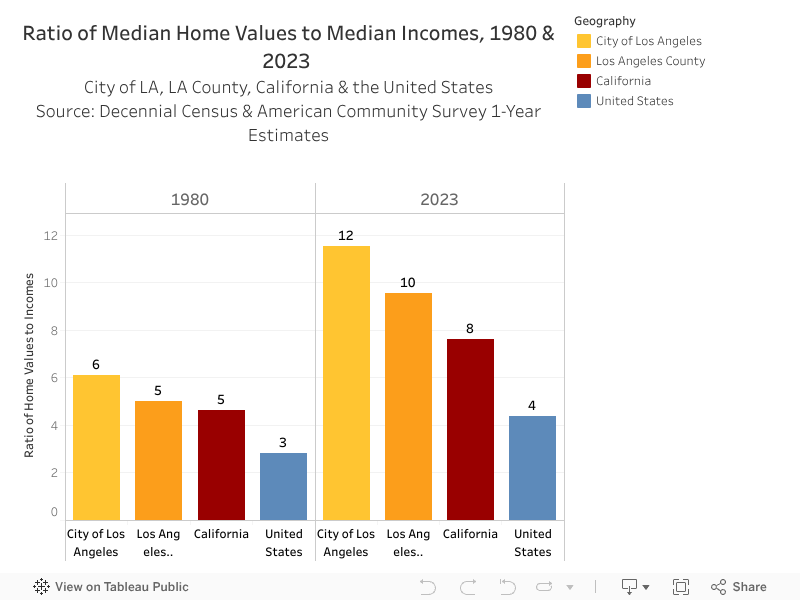
The most straightforward explanation for the differences in homeownership rates between the City of Los Angeles, LA County, California, and the United States is the disparity between homeownership costs (measured by median home values)1 and median incomes.2 In 1980, the median home value in Los Angeles County was $369,300 (adjusted for inflation), which was five times higher than the median household income of $73,700. In comparison, the median home value in the United States was $198,500, just under three times the median household income of $70,700.
While Los Angeles County was already more expensive in 1980, the gap has only widened. By 2023, the median home value in Los Angeles County had risen to $828,700, nearly ten times greater than the median household income of $86,600. Across the U.S., median home values are now just over four times greater than median incomes. The disparity is even more pronounced in the City of Los Angeles, where home values are nearly 12 times greater than incomes. The chart below shows the ratio of median home values to median incomes in 1980 and 2023. Hover over a geography to see home values and household incomes in that year.
Current Homeowners Are Staying in Their Homes Longer
In addition to high median home values compared to median incomes and a lack of new construction (see Supply chapter), another factor driving down homeownership rates is the lack of turnover. Current Los Angeles County homeowners are remaining in their homes for longer periods, leading to fewer opportunities for households to transition from renting to owning through the existing housing supply. In 2023, 44% of Los Angeles County homeowners had been living in their homes for more than 20 years, compared to 36% of homeowners statewide and 33% of homeowners nationally, shown in the chart below.
One factor contributing to this trend in California is Proposition 13, which limits property tax increases and creates a strong financial incentive for homeowners to remain in their homes, especially in areas where home values have appreciated substantially. This is particularly evident in Los Angeles County, where rising home prices make it costly for homeowners to move due to the potential for higher property taxes on newly purchased properties.

Younger Generations May Be Occupying Inherited Homes
Another factor that may contribute to less turnover of existing supply is younger generations moving into homes they inherited from their parents or grandparents. Fewer homeowners in Los Angeles County had a mortgage on their home in 2023 than in 2010, consistent with both statewide and national trends. However, in Los Angeles County and across California, the share of homeowners who don’t have a mortgage is increasingly younger.
Between 2010 and 2023, the share of homeowners without a mortgage who are ages 44 or younger increased by nearly 50% in Los Angeles County and statewide. Owning a home without a mortgage can mean that young homeowners are purchasing homes with cash or are inheriting and moving into homes that are fully paid off. However, this growing group of young homeowners without a mortgage has significantly lower incomes on average than homeowners of the same age who have mortgages. This income gap suggests that in Los Angeles County and across California, younger generations may be increasingly occupying homes that were purchased and paid off by previous generations rather than selling them.
Homeownership Declines Most Among Middle-Income Households
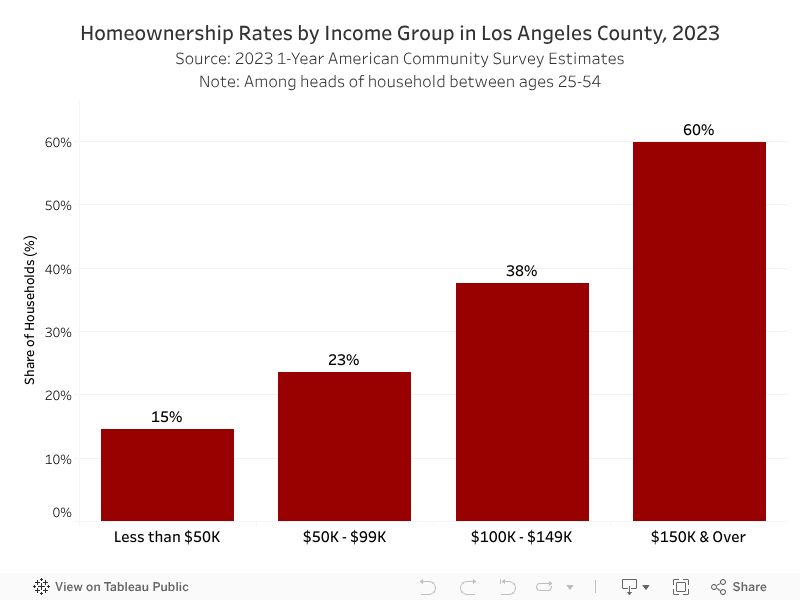
While high median home values and a lack of turnover provide insight into the current housing market, income continues to be a defining factor in homeownership opportunities in Los Angeles County. As shown in the chart below, homeownership rates in Los Angeles County in 2023 varied significantly by income level. Among households earning $150,000 or more per year, 60% were homeowners. In contrast, only 38% of households earning between $100,000 and $149,000, 23% of households earning between $50,000 and $99,000, and just 15% of households earning less than $50,000 were homeowners.
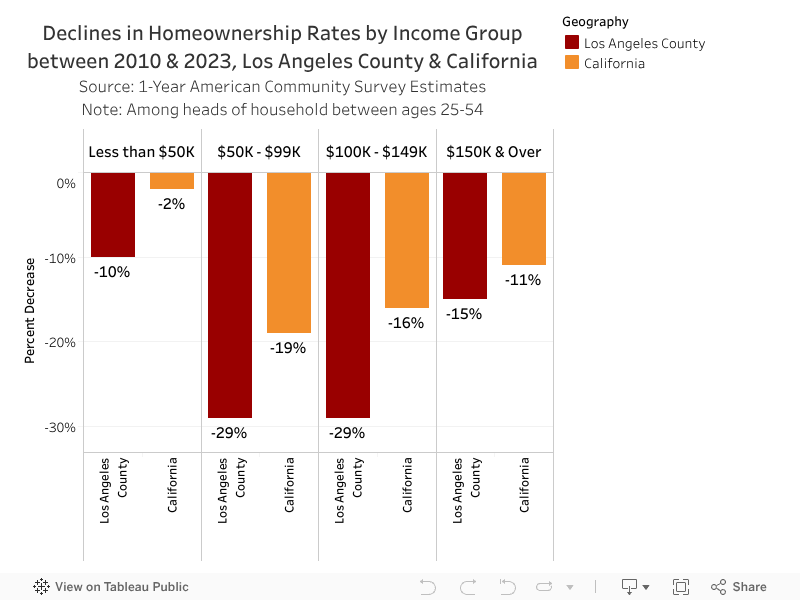
Homeownership rates have dropped across every income group over the last decade in Los Angeles County. However, homeownership rates fell the fastest among the two middle income groups, i.e., those making between $50,000 – $149,000 per year across all household members.3 In 2023, nearly 29% fewer households in this income range were homeowners than in 2010. By comparison, homeownership rates declined by 15% among households making $150,000 or more. While homeownership rates also fell across income groups in California, the declines were less severe than in Los Angeles County. The chart below shows the decline in homeownership rates by income group in Los Angeles County and the state of California from 2010 to 2023.4
Growth in Asian/Pacific Islander Homeownership
Beyond income, race and ethnicity are central to understanding homeownership patterns, with significant disparities across demographic groups in Los Angeles County. As of 2023, homeownership rates were highest among Asian/Pacific Islander and White households in Los Angeles County.5 56% of Asian/Pacific Islander households and 53% of White households owned the home they live in, compared to 45% of all households. By comparison, fewer Hispanic/Latino households (39%), Black households (31%), and American Indian/Alaska Native households.6
Across all racial/ethnic groups in Los Angeles County, only Asian/Pacific Islander households saw increases in homeownership between 2010 (50%) and 2023 (56%). Although homeownership rates among Asian/Pacific Islander households increased across California over the same period, Asian/Pacific Islander households in Los Angeles County experienced larger gains. The chart below shows homeownership rates across racial/ethnic groups in Los Angeles County in 2010 and 2023.

Distinct Declines in Black Homeownership
Between 2010 and 2023, homeownership among Black households in Los Angeles County decreased faster than any other racial or ethnic group, dropping from 35% to 31%. This decline has deepened existing racial inequalities in homeownership. Nationally, Black households faced significant economic losses during the Great Recession7 largely due to the unregulated sale of subprime loans,8 which disproportionately targeted Black and Hispanic/Latino neighborhoods. A report from New York University’s Furman Center found that Black borrowers were three times more likely to receive subprime loans compared to white borrowers in 2006 (NYU Furman Center).
When the housing bubble burst in 2007, widespread foreclosures on homes financed by subprime loans caused major economic instability in middle-class Black and Hispanic/Latino neighborhoods (Economic Policy Institute). In the years that followed, homeownership rates among Black households began to recover nationally and statewide, starting in 2016. However, in Los Angeles County, Black Angelenos have experienced a steady decline in homeownership since 2010, reflecting a stark contrast to the broader recovery trends.
According to LABarometer survey data, disparities in homeownership rates between Black households and White households in Los Angeles County are persistent even after controlling for other demographic characteristics (education, income, etc.) While there is no evidence that Black homeowners are more likely to leave homeownership or leave Los Angeles County, there is some suggestive evidence that Black renters are less likely to become homeowners compared to White renters. In any given survey wave, Black renters in the past year had 52% lower odds than White renters of becoming homeowners within the next year.9
Geographic Inequities in Homeownership Access
The ongoing racial disparities in homeownership rates are not coincidental; they are the result of historic policies that racially segregated neighborhoods and limited homeownership opportunities for communities of color. Like many urban areas across the U.S., the geography of homeownership in Los Angeles was shaped by federal policies in the 1930s and 40s that were designed to make it easier for families to buy homes with smaller down payments. This section examines homeownership rates across Los Angeles County neighborhoods through the lens of these policies.
In 1934, the government created the Federal Housing Administration (FHA) and the Home Owners Loan Corporation (HOLC), which introduced federally-backed mortgages with low down payments and longer repayment terms, ushering in the modern era of home mortgage lending. Thanks primarily to these policies, between 1940 and 1960, the U.S. experienced the single largest increase in homeownership in the nation’s history, primarily in urban areas (Fetter).
However, not all neighborhoods and demographic groups benefited from the homeownership boom. As part of its lending guarantee, the HOLC developed a neighborhood rating system ranging from A to D to indicate areas where government-backed loans were more or less likely to be issued. Neighborhoods were graded as follows: A – Best, B – Still Desirable, C – Definitely Declining, and D – Hazardous (Mapping Inequality).
In Los Angeles, neighborhoods that were subject to deed restrictions10 were typically assigned an A rating, as these areas were considered stable and desirable. Neighborhoods with “first-grade qualifications” but located near less desirable areas received a B rating. C areas were seen as starting to decline, with signs such as changes in racial composition, including an influx of immigrant communities. Neighborhoods where even a few Black families lived, or those with mixed racial/ethnic populations, were often given a D rating, marking them as “hazardous for investment” (Avila 35).
Residents in neighborhoods with lower rates were excluded from access to homeowner loans and other financial services that were critical to the economic growth seen in many predominantly white communities that received higher ratings. Communities with “D” ratings were colored “red” on the HOLC maps, and the discriminatory practice was coined as “redlining.”
Los Angeles’ Historic South Central corridor, home to a growing Black population fleeing racialized violence in the South, was redlined and excluded from the postwar homeownership boom. HOLC officials also redlined other communities in East Los Angeles, such as Boyle Heights, because they were home to a “melting pot” of racial, ethnic and immigrant groups (Avila 35).
In addition to discriminatory policies from the federal government, local policies and actions have also impacted the picture of homeownership across Los Angeles neighborhoods. For example, in 1949, the City of Los Angeles began a 10-year campaign to displace Mexican American residents of the Chavez Ravine, first for a public housing project that never materialized and eventually as the site for Dodger Stadium. Despite being home to the largest share of property owners of any Mexican American community in the greater Los Angeles region, the City declared the community a “blighted area.” It used eminent domain to seize the land of over one thousand Mexican American households (Lopez 459).]
Homeownership Rates Lag in Formerly Redlined Communities
Although the 1968 Fair Housing Act formally outlawed redlining, the legacy of these nearly century-old policies can still be seen in the geography of homeownership in Los Angeles today. Analysis of current homeownership rates over HOLC redlining maps shows that in redlined communities, just 30% of current-day households are homeowners. Communities in grade C (definitely declining) had similarly low homeownership rates, with just 32% of households owning their homes in 2023. By comparison, in neighborhoods given a grade of “A” by the HOLC (most desirable), 65% of households are homeowners in 2023. In “B” neighborhoods, considered still desirable, the homeownership rate is 43% (for additional details about this analysis, see the Data & Methods Appendix). Explore current-day homeownership rates and historic redlining boundaries across Los Angeles neighborhoods in the map below.
Altadena, a neighborhood devastated by the Eaton Fire in January 2025, was once a predominately white community, with nearly 80% of homes including racially restrictive deeds in the 1940s. After the 1968 Fair Housing Act outlawed housing discrimination based on race/ethnicity, however, “The Meadows” in Altadena became one of the first middle-class communities in Los Angeles County to welcome Black families. Thanks to community organizations like “Altadena Neighbors” who encouraged integration, by 1980, it was one of the most racially diverse neighborhoods in the county (Altadena Historical Society). Before this year’s fire, 81% of Black households in Altadena were homeowners, compared to just 31% of Black households across Los Angeles County (see more information about the fire impacted area in Altadena on the Eaton Fire Community Profile). As one of the few areas in the region where Black families could access homeownership, Altadena became a vital space for building generational wealth and stability. As Altadena recovers from the Eaton Fire, prioritizing its legacy as a cornerstone for Black homeownership is essential to advancing the broader goal of equitable homeownership access across Los Angeles County.
Contributors
- Authors
- Elly Schoen, USC Lusk Center for Real Estate
- Jared N. Schachner, USC Price School of Public Policy
- Research Team
- Cameron Yap, USC Lusk Center for Real Estate
- Evan Sandlin, LABarometer
- Kyla Thomas, LABarometer
- Devyani Ramamoorthy, USC Lusk Center for Real Estate
- Justin Culetu, USC Lusk Center for Real Estate
- Elinor Amir-Lobel, USC Lusk Center for Real Estate
- Rediet Retta, USC Lusk Center for Real Estate
- Caroline Ghanbary, USC Lusk Center for Real Estate
- Nicole Ouyang, USC Lusk Center for Real Estate
- Daiqi He, USC Lusk Center for Real Estate
- Ramon Luquin, USC Lusk Center for Real Estate
Citations
LABarometer is an internet survey panel of approximately 2,000 individuals randomly selected from households throughout Los Angeles County. Since 2019, LABarometer has operated as a subpanel of the Understanding America Study (UAS), a national internet survey panel managed by the USC Dornsife Center for Economic and Social Research. Surveys are fielded to the LABarometer panel on a biannual basis to monitor social and economic conditions in L.A. County, with a focus on four key issues: livability, affordability, mobility, and sustainability. For more information about LABarometer, including up-to-date demographic information, recruitment and retainment procedures, standard variables, and survey weights, please visit the LABarometer website: https://dornsife.usc.edu/cesr/labarometer/
Avila, E. (2004). The Nation’s “White Spot”: Racializing Postwar Los Angeles. In Popular Culture in the Age of White Flight: Fear and Fantasy in Suburban Los Angeles (1st ed., pp. 20–64). University of California Press.
Digital Scholarship Lab, University of Richmond. Mapping Inequality: Redlining in New Deal America. Link
Fetter, D. (2014). The Twentieth‐Century Increase in U.S. Home Ownership: Facts and Hypotheses. In Housing and Mortgage Markets in Historical Perspective, 329 ‐ 350. University of Chicago Press. Link
Furman Center for Real Estate and Urban Policy, New York University. (2009, November 18). The High Cost of Segregation: The Relationship Between Racial Segregation and Subprime Lending (Policy Brief). Link
Lopez, R. (2009). Community resistance and conditional patriotism in cold war Los Angeles: The battle for Chavez Ravine. Latino Studies, 7(4), 457–479. https://doi.org/10.1057/lst.2009.38
Rothstein, R. (2012, April 3). Subprime loan debacle intensified segregation. Economic Policy Institute. Link
Topousis, D. (2021). Redlining in Altadena. The Echo, 94(2), 1-5. Link
Footnotes
- Value is captured by asking the head of household’s estimate of how much the property (house and lot, mobile home and lot (if lot owned), or condominium unit) would sell for if it were for sale.
- Household income is calculated by adding the individual income of the head of a household and the incomes of all other inhabitants above 15 years of age, regardless of their relation to the head of the household. Income is defined as any money that a person earns from work, selling products or services, or any other streams such as Social Security payments, pensions, child support, public assistance, annuities, money derived from rental properties, interest and dividends, etc.
- Los Angeles County’s population is rapidly aging/retiring and older adults are significantly more likely to be homeowners. As aging homeowners retire and move into lower income categories, it may cause homeownership rates in lower income categories to appear as if they are rising, when in fact, existing homeowners are just retiring. In order to avoid this trend in the data, this analysis of homeownership rates by income is limited to households where the head of household is considered “of prime working age” (between the ages of 25 and 54).
- The 2010 income figures have been adjusted for inflation to 2023 dollars to ensure a consistent comparison of income levels over time.
- The race/ethnicity of a household is determined by how the head of household (the person whose name is first on the lease or mortgage) defines their own race/ethnicity. Therefore, this definition of race/ethnicity at the household level may not correctly identify all household members in interracial households.
- There are higher margins of error when determining homeownership among American Indian/Alaska Native households due to smaller population sizes. We estimate a homeownership rate within the range of 34% to 44% for this group in 2023.
- The Great Recession refers to the global economic downturn that began in December 2007 and lasted until June 2009. It was the most severe financial crisis since the Great Depression of the 1930s, triggered by the collapse of the housing bubble and the subsequent banking and financial crisis. The housing market crash, particularly the subprime mortgage crisis, led to widespread foreclosures, massive job losses, and a sharp decline in consumer wealth, severely impacting both the U.S. and global economies.
- Subprime loans are high-risk mortgages offered to borrowers with poor credit histories, often at higher interest rates.
- This difference is marginally significant (p < .1) controlling for other income and other demographics.
- Deed restrictions were legal agreements that limited who could own property, often excluding certain racial or ethnic groups.
