Table of Contents
Key Insights
- Housing production has dropped significantly since the 1950s, even as the county’s population has continued to grow.
- Over the past seven years, just 10% of new rental housing units were affordable to low-income households.
- Accessory Dwelling Units (ADUs) have increased supply, but their impact on affordability remains unclear. Despite this source of housing growth, Los Angeles County continues to fall well short of its state-mandated housing goals.
- The City of Los Angeles has led most jurisdictions in per capita housing production, but construction timelines remain long—especially for larger multifamily developments.
- Just over 6% of the county’s rental housing stock is subsidized by federal or state programs—far lower than in some other major U.S. cities like New York. Subsidized units are disproportionately concentrated in lower-income neighborhoods.
- Despite the addition of thousands of permanent housing beds for unhoused people, homelessness has continued to rise over the last decade due to inflows – a trend that has only recently reversed
Los Angeles County’s housing crisis is not just about rising rents or population pressures—it’s about a persistent and deep-rooted failure to build enough housing. For decades, the region has added far fewer homes than needed, especially for low- and middle-income residents. The result is a fragmented and inefficient system in which housing is expensive to finance, slow to deliver, and often out of reach for the people who need it most. Research has shown that Los Angeles has one of the weakest relationships between housing demand and housing production of any major U.S. metro area—meaning that even when prices rise, new housing supply is slow to follow (Baum-Snow & Han, 2024; Gyourko & Krimmel, 2021).
This chapter unpacks what that means in practice. It begins by placing today’s housing production in historical context, showing how construction volumes have declined sharply over the decades—even as the population has continued to grow. From there, it offers a clear, data-driven look at new housing production across Los Angeles County today: what kinds of units are being built, where they’re being built, who they’re serving, and how long it takes to bring them online. It also highlights the systems and structures that shape supply—whether through increasing building costs, slow construction timelines, or limited and complex public subsidies. Readers will come away with both the numbers and the context: a grounded understanding of why housing supply in Los Angeles continues to fall short—not just in quantity, but in speed, equity, and affordability.
Decades of Population Growth and a Shrinking Response
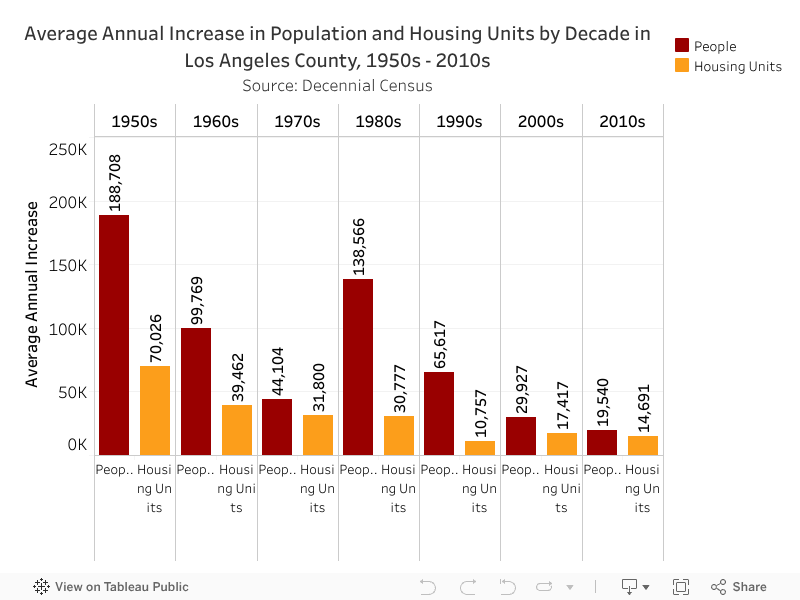
Los Angeles County experienced several periods of rapid population growth during the 20th century (see Population Characteristics chapter). But over time, the pace of housing development has slowed. During the 1950s, Los Angeles County added 1.9 million residents, a striking 45% increase in population, and housing supply grew sharply in tandem, driven by two key factors: a robust federal role in subsidizing private development through low-interest loan programs (Congressional Research Service), and a relatively low and stable cost of construction. Between the end of World War II and the mid-1970s, the cost of building a home rose at about the same pace as inflation, meaning that, as real incomes rose, housing became more affordable. This combination of strong public investment and manageable construction costs helped the county add more than 700,000 new housing units (an average of 70,000 per year) in the 1950s to meet rising demand.
Starting in the early 1970s, the federal government moved away from funding public housing, and by the 1980s, most affordable housing development came to rely on tax credits and local funds instead (Congressional Research Service). Meanwhile, Proposition 13, passed in 1978, severely limited property tax revenues for local governments in California, reducing their capacity to fund infrastructure and services needed to support new housing development (CA LAO). At the same time, the cost of building a house rose inexorably, in part because construction costs rose more rapidly than inflation, but more importantly, because urban land prices started rising at a breakneck pace.
During the 1980s, Los Angeles County experienced another large population influx – adding nearly 1.4 million residents; however, the county added only 307,800 housing units (an average of 30,800 per year) during that decade, despite the increase in demand. As the county’s population continued growing in subsequent decades, soaring land values and restrictive zoning practices further hindered housing production. Los Angeles County went from averaging over 70,000 new units per year in the 1950s, to just over 30,000 per year in the 1970s and 1980s, and just under 15,000 units per year in the most recent decade (shown in the chart below).
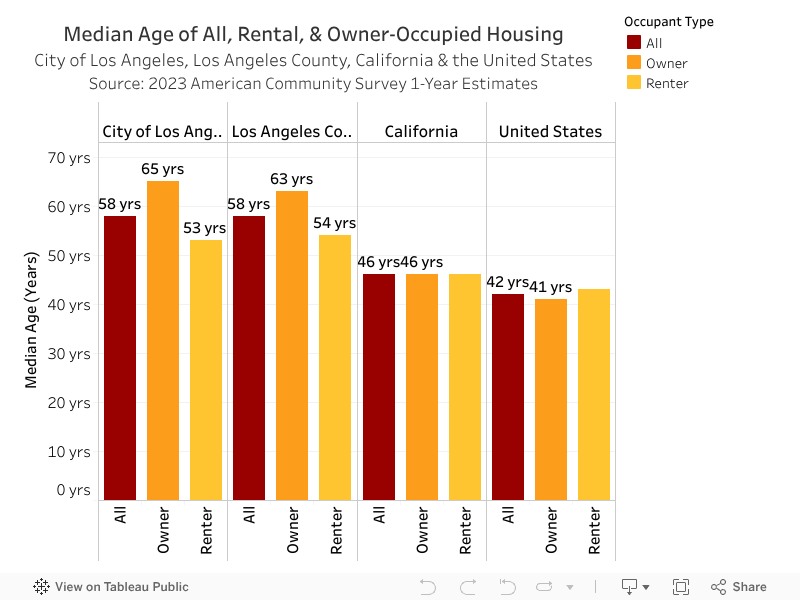
After decades of limited housing production, Los Angeles County’s housing stock is, on average, older than both the state and national averages. The median age1 of LA County’s housing stock is 58 years old (built in 1965), making it 12 years older than the median in California (1977) and 16 years older than the national median (1981). On average, owner-occupied homes in Los Angeles County are nearly 10 years older than renter-occupied ones. In contrast, owner- and renter-occupied housing stock in California and the U.S. are roughly the same age. View the median age of housing units in the city, county, state, and nation in the chart below.
Current Trends in Countywide Housing Production
As Los Angeles County continues to grapple with the legacy of underbuilding, this section examines recent progress. It presents housing production data from the past seven years to better understand where new development is occurring, how much of it addresses affordability, and how local jurisdictions are responding to state mandates.
Each year, cities and unincorporated areas across California are required to submit a Housing Element Annual Progress Report to the California Department of Housing and Community Development (HCD) reporting their progress in meeting local housing production goals. This section measures new housing production in Los Angeles County between 2018 and 2024, based on reported numbers of Certificates of Occupancy (CofOs) for new units.2
Most New Units Are Market-Rate Rentals
Between 2018 and 2024, 151,878 new housing units were certified for occupancy, meaning they comply with building and safety codes and a resident can legally move in. Of these units, 125,980 (83%) were designated as rental units and 25,898 (17%) were owner-occupied units, continuing the widening age gap between the renter- and owner-occupied housing stock in the county.3
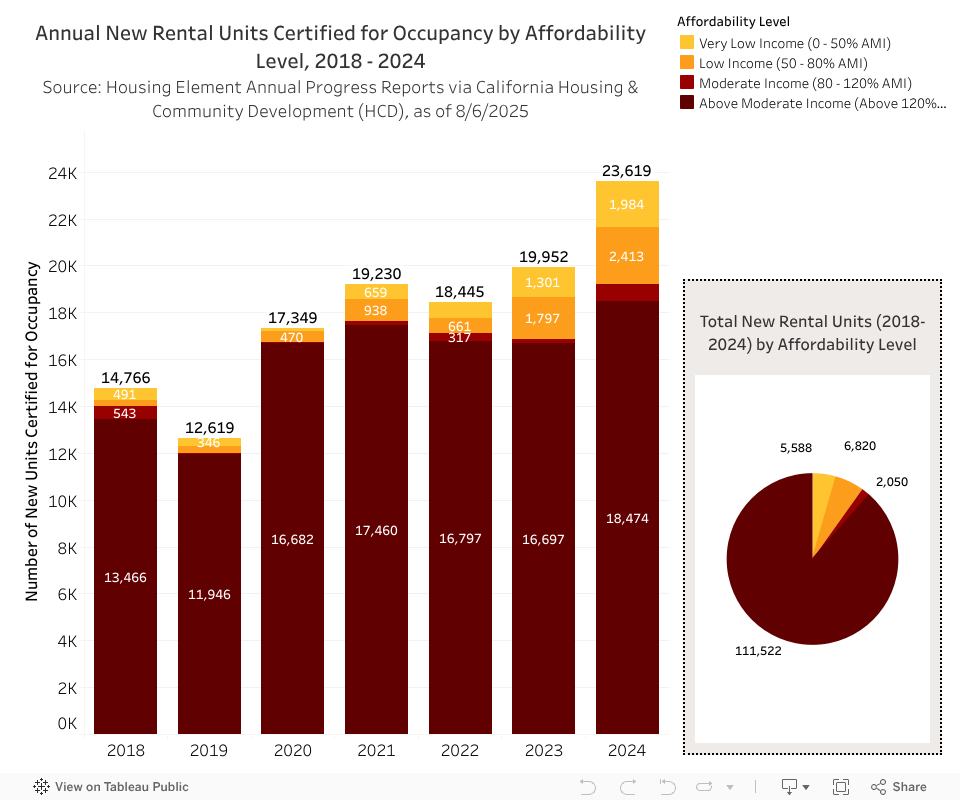
Of the 125,980 new rental units produced between 2018 and 2024, just 12,408 (10%) were affordable to low-income households. Of these:
Estimates on the shortage of affordable housing in Los Angeles County vary:
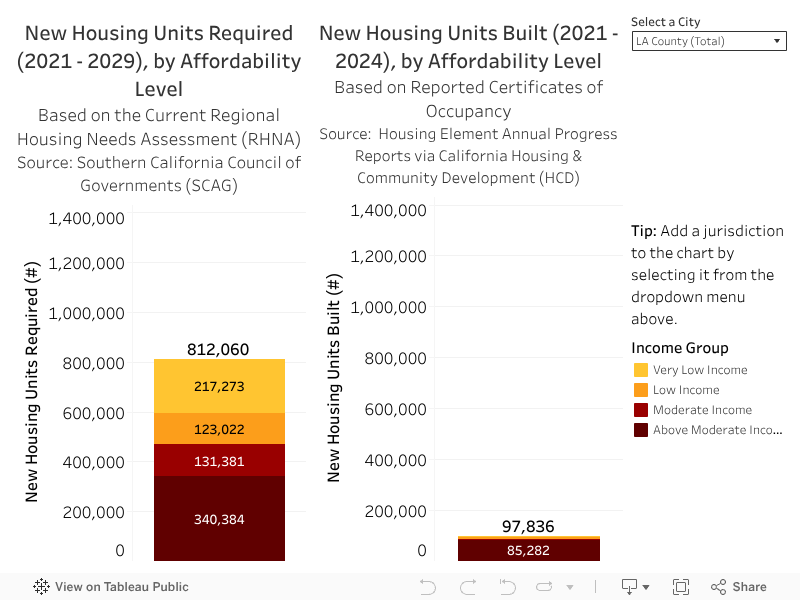
- The Regional Housing Needs Assessment (RHNA) mandates that over 340,000 new units affordable to households earning less than 80% of area median income be built between 2021 and 2029 (Southern California Association of Governments, 2021).
- Neighborhood Data for Social Change estimates a shortfall of over 578,000 rental units for households making less than 50% of area median income – this figure includes people currently experiencing homelessness.
Regardless of the methodology or source cited, it’s clear that Los Angeles County is falling well short of producing enough affordable housing to meet the current need.
More affordable rental units were certified for occupancy in 2024 than in any other year since 2018. As shown in the chart below, in 2024, just under 4,400 new affordable rental units were certified for occupancy – a sizable increase from previous years. This increase in new affordable rental units mirrors a broader increase in all new housing units certified for occupancy in recent years, discussed in the following sections.
Accessory Dwelling Units (ADUs) Are Driving Growth
Looking across both renter and owner-occupied units, fewer than 20,000 new housing units were certified for occupancy in both 2018 and 2019, reflecting the slow growth of the housing stock during the 2010s. Beginning in 2020, however, housing production began to rise, reaching a peak of 28,386 units in 2024.6
A large part of the increase in new housing production over the last few years is due to Accessory Dwelling Units (ADUs), secondary housing units (that must include a kitchen and a bathroom) on a land parcel with previously existing housing. In 2018, just 10% (1,624) of all units certified for occupancy were ADUs across LA County. By contrast, between 2022 and 2024, ADUs accounted for 38% (28,270) of all new Certificates of Occupancy. See the increase in ADUs certified for occupancy over time in red on the chart below.
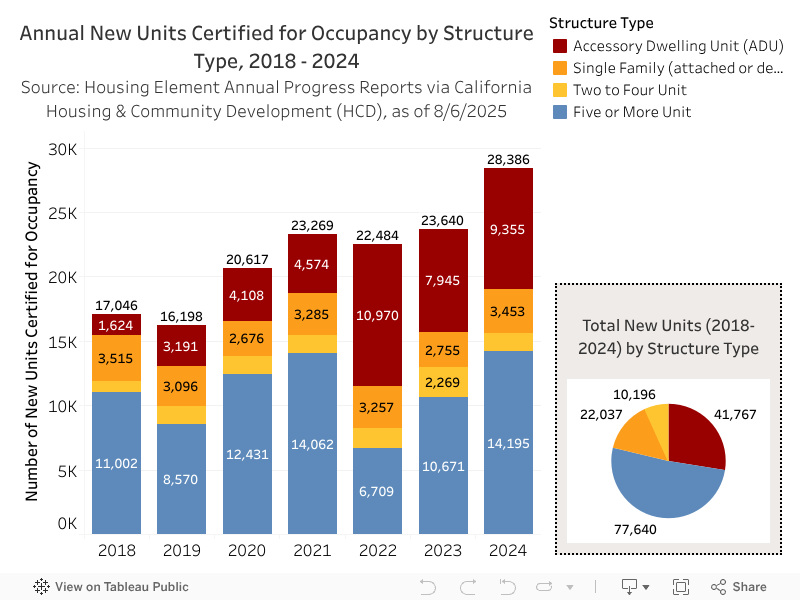
Note: Chart above excludes 238 mobile home units across years.
The State of California and Los Angeles County have prioritized Accessory Dwelling Units (ADUs) as a key housing strategy because they offer a cost-effective, flexible way to add homes within existing neighborhoods—often without major new infrastructure.
- At the state level, laws such as SB 1069 (2016) and AB 68 (2019) streamlined approvals, removed minimum lot size and parking requirements, and allowed multiple ADUs per lot.
- More recently, AB 1033 (2023) authorized cities to allow ADUs to be sold separately, expanding ownership opportunities.
- Locally, the City of Los Angeles adopted Ordinance 186481 in 2019 to align with state law and launched a Standard Plan Program offering pre-approved ADU designs to simplify permitting.
- Los Angeles County has also updated its zoning code to speed up ADU development in unincorporated areas.
Despite the potential upsides of ADUs, it’s not evident that all property owners who build ADUs put them on the traditional rental market. A 2014 survey of ADU owners in Beverly Hills found that nearly half of them housed someone related to them (Crane, 2020), suggesting that ADUs may not contribute to the housing stock in the same way new single- or multifamily units do. And while ADUs add to overall supply, they are not significantly contributing to affordability: 93% of new ADUs certified for occupancy were designated as affordable to Above Moderate Income households only.7
Without ADUs, new housing production in Los Angeles County remains limited. Between 2018 and 2024, the county did not certify more than 20,000 non-ADU units in any single year.
LA City Has Led the Way, but Other Cities Are Catching Up
Looking across both renter and owner-occupied units, between 2018 and 2024, the City of Los Angeles certified more new housing units per capita than nearly every other jurisdiction in the county. With 280 new units per 10,000 residents—second only to Rolling Hills Estates—Los Angeles stood out not only for its per capita rate but also for its volume: nearly 108,000 units certified during this seven-year period, compared to fewer than 7,000 units in any other single jurisdiction.
Among the top ten jurisdictions by per capita production were Monrovia (279), Hidden Hills (254), Duarte (209), and West Hollywood (209), though not all contributed housing that supports broader affordability goals. For example, Hidden Hills did not certify a single new rental unit between 2018 and 2024. The chart below shows the jurisdictions with the highest per capita housing production during this period. Use the filter on the right-hand side to explore additional jurisdictions.

In California, the state determines each region’s housing need through the Regional Housing Need Determination (RHND), which is based on projected growth, existing need, and equity factors. The Southern California Association of Governments (SCAG) then allocates this need among local jurisdictions through the Regional Housing Needs Assessment (RHNA). Each jurisdiction, including those in Los Angeles County, is required to develop a Housing Element—a component of its general plan—that outlines how it will accommodate its share of new housing, including zoning changes and policy strategies. This process is mandated every eight years; the current cycle covers 2021–2029.
Although the City of Los Angeles continues to account for a disproportionate share of housing production, other jurisdictions across the county have begun to step up. In 2024, 62% of all units certified for occupancy countywide were in the City of Los Angeles—still the majority, but down from 81% in 2018. This shift reflects a modest but notable increase in production in other cities.
While this trend is encouraging, the scale of production still falls far short of what’s needed. Under the current Regional Housing Needs Assessments (RHNA) cycle, jurisdictions in Los Angeles County must collectively permit 812,060 new units by 2029—a goal that remains well out of reach under current conditions. Explore the dashboard below to see how each of Los Angeles County’s jurisdictions are faring in reaching their goals. Add a city to the chart using the menu on the right.8
LA City’s Permit-to-Occupancy Timelines Are Long—Especially for Multifamily

This section examines how long it takes for new housing in the City of Los Angeles to move through the final phase of development—from building permit to Certificate of Occupancy. Over the past seven years, nearly three-quarters of all housing built in the county was produced in the city.9
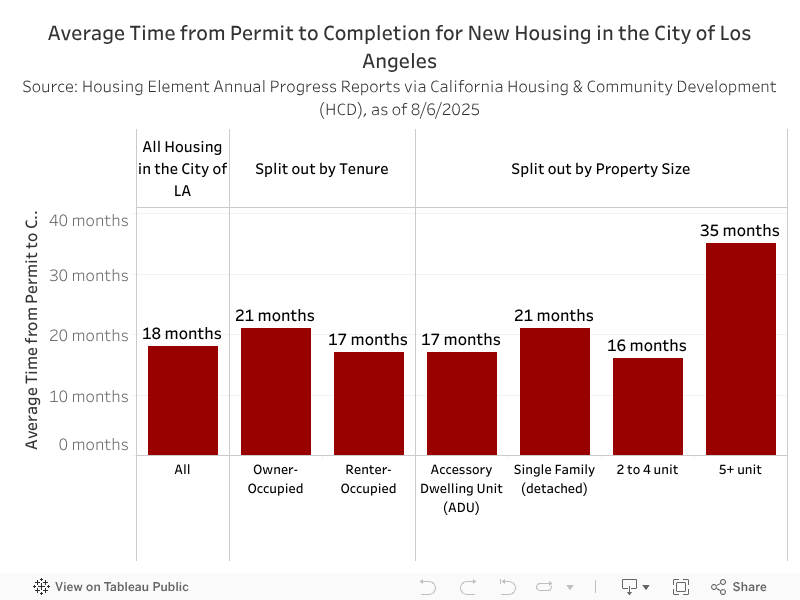
On average, it takes just over 18 months for a new housing development in Los Angeles to go from permit to completion. Nationally, that process takes just 4 to 6 months (Construction Coverage, 2025).
In Los Angeles, owner-occupied units took longer (21 months) on average than rental units (17 months), which may be due to more opportunities for standardization in rental construction. Even ADUs – smaller, simpler, single-unit structures – still average 17 months between initial permitting and certificate of occupancy. Multifamily projects (with five or more units) took a staggering 35 months from permitting to completion. The chart below shows average permit to completion times by tenure and property size.
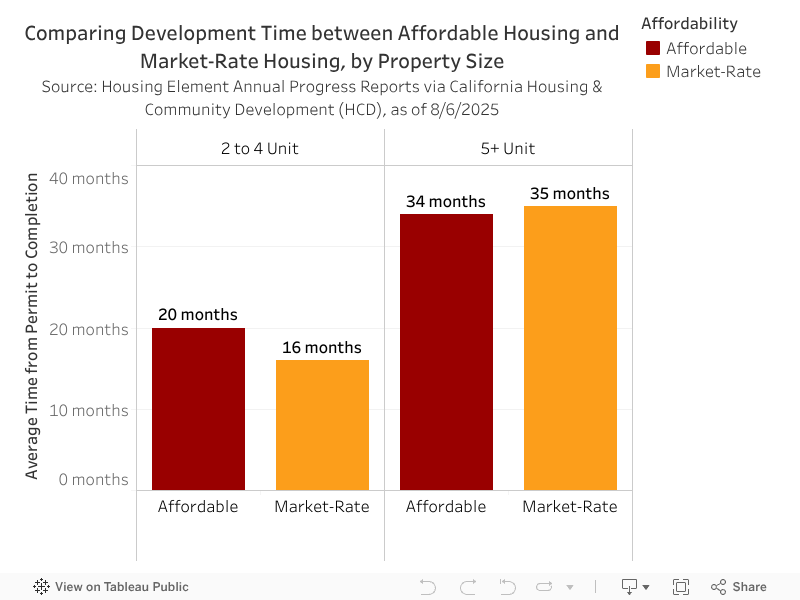
Contrary to popular belief, most affordable units in the city don’t have longer construction timelines than market rate projects of a comparable size. Although affordable 2–4 unit properties took an average of four months longer to complete than their market-rate counterparts, they represent only a small share of all affordable units built in Los Angeles. Most affordable housing developments are multifamily buildings with 5 or more units—and for these, construction timelines are actually shorter than for comparable market-rate projects.
As shown in the chart below, affordable multifamily (5+ unit) developments moved from permitting to completion about one month (43 days) faster than comparable market-rate projects. However, with these large developments averaging nearly three years to complete, this time savings is minimal.
The City of Los Angeles’s Executive Directive 1 (ED1), passed in 2022, streamlines the permitting process for 100% affordable housing projects. However, its impact on delivery will be limited if construction timelines—particularly for large multifamily developments—remain measured in years rather than months. Because the vast majority of affordable housing in Los Angeles is built as multifamily, tackling the overall slow pace of multifamily construction—regardless of affordability status—is essential to meeting the region’s housing goals.
Developer Insights - Why is Building in Los Angeles so Difficult?
In August 2024, the Lusk Center for Real Estate administered a non-representative survey to Southern California housing developers in its network to assess barriers to developing housing in Los Angeles County. Their top concerns included:
Costs
Time
Regulations
Subsidized Housing Inventory in Los Angeles County
Because affordable housing developments generate less rental revenue per unit, they often require external subsidies to close financing gaps. This section focuses on the major federal and state programs currently used to subsidize housing in Los Angeles County as well as housing options for people experiencing homelessness. Future editions of SOLACHAN will aim to include data on local housing programs to provide a more comprehensive view of the subsidized and incentivized housing landscape.
Federal and State Subsidized Housing Makes Up Less Than 7% of Rentals
After the federal government moved away from funding public housing in the 1970s, the Low Income Housing Tax Credit (LIHTC), established in 1986, became the primary vehicle for federally incentivizing affordable housing. State agencies like California’s HCD became essential partners, offering companion financing to meet federal affordability standards and fill local funding gaps. Developers often combine LIHTC with other state subsidies and local capital to create complex “layer cakes” of funding, a model that can lead to high administrative burdens and vulnerability to policy changes across multiple layers of government. Combined with broader housing production challenges in the region, this complexity has contributed to Los Angeles County’s relatively low stock of federally and state-subsidized housing.
There are an estimated 2,059 multifamily rental properties that are being actively subsidized, assisted, or incentivized through federal and state programs in Los Angeles County. These properties have at least 123,724 subsidized units and about 140,000 total units. The estimated number of subsidized units represents roughly 6.3% of the rental housing stock in Los Angeles County. Some properties are fully affordable, while others may have a mix of affordable and market-rate units.10 By comparison, units in federally and state-subsidized housing make up approximately 23% of the rental housing stock in New York City (NYU Furman Center, n.d).11
LIHTC is by far the most common program used to fund the development and preservation of affordable rental housing in Los Angeles County. LIHTC is currently being used to subsidize over 1,400 properties, which accounts for about 71% of non-public housing properties (1,404 of 1,977) actively receiving a subsidy from federal or state programs across the county.12 However, many properties utilize a combination of multiple federal and state programs, making it difficult to fully isolate the impact of any one program on the affordable housing stock.13 For example, just under one-third of LIHTC-funded properties in Los Angeles County also use another source of federal or state funding.
The table below shows the major federal and state subsidy programs supporting housing in Los Angeles County. The first column displays the number of properties using each program, and the second shows the percentage of those properties that also receive support from at least one other program listed.
Subsidy Program | Number of properties utilizing program (Total number of residential units in these properties)* | Of those properties, what share are utilizing at least another program that is listed in this table? |
HUD/CTCAC LIHTC | 1,404 (94,526 units) | 32% |
HUD Contracts | 548 (39,386 units) | 42% |
HCD | 363 (19,102 units) | 59% |
CalHFA | 132 (10,780 units) | 76% |
HUD Insured Mortgage** | 119 (14,841 units) | 72% |
* Depending on the program, not all units in the properties are income-restricted or subsidized by the specific program.
** Only included properties with any active Section 221(d)(3), Section 221(d)(4), Section 236, or Section 202 financing.
In addition to the properties in the table above, Los Angeles County has approximately 9,000 public housing units managed by Los Angeles County Development Authority, Housing Authority of the City of Los Angeles, Housing Authority of the City of Baldwin Park, and Housing Authority of the City of Lomita.
Subsidized Properties are More Common in Low-Income Neighborhoods
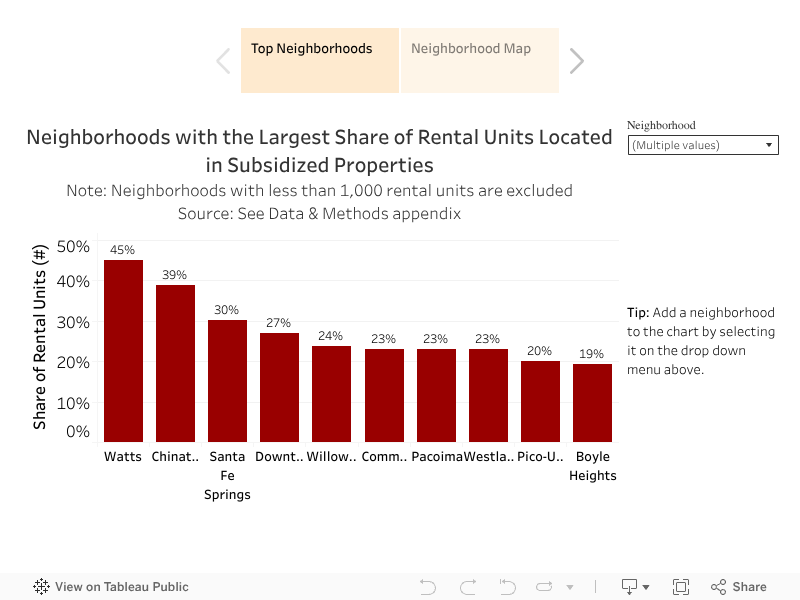
Subsidized properties, including public housing sites, are unevenly distributed across Los Angeles County neighborhoods14. In Watts, a neighborhood in South Los Angeles, 45% of rental housing is located on a property with at least one federal or state subsidy or program – the highest share of any neighborhood in the county. By comparison, there are nine neighborhoods across the county where less than 1% of the rental housing stock is subsidized.
Neighborhoods with large shares of subsidized units have lower median incomes. The chart below shows the ten neighborhoods with the largest share of subsidized properties. In 2023, the median household income in these neighborhoods was $62,100, compared to the countywide median of $87,800. Flip between the tabs in the figure below to see a map of subsidized units by neighborhood.
Historically, subsidized housing has been criticized for concentrating in high-poverty areas with limited resources, potentially reinforcing income segregation and restricting access to higher-opportunity neighborhoods. In response, programs like LIHTC have begun to incentivize development in more affluent or opportunity-rich areas (Owens & Smith, 2023). About a third of the newly constructed LIHTC properties since 2021 (55 out of 181 properties) are located in neighborhoods with median household income above the countywide median.
In addition to subsidized housing units, tenant-based assistance—like Housing Choice Vouchers (HCVs)—plays a key role in helping families access rental housing on the private market. According to HUD’s Picture of Subsidized Households, there were 91,797 families using HCVs in Los Angeles County in 2024, representing about 5% of all renter families in the county.15
View housing choice vouchers by neighborhood on the NDSC map.
Permanent Housing for Homeless Angelenos Has Grown, But Not Fast Enough
Alongside affordable housing subsidized by federal and state funding sources, Los Angeles County has made substantial investments in housing options for people experiencing homelessness over the last decade. In 2016, Los Angeles County voters passed Measure H, a tax that provided over $355 million annually for homeless services, prevention programs, and rental subsidies. In the same election, voters in the City of Los Angeles passed Proposition HHH to fund the development of housing set aside for people experiencing homelessness with high needs. Together, these initiatives have significantly expanded prevention efforts, service delivery, and housing options across the county. This section explores the availability of different types of permanent housing options for houseless people since the passage of Measure H and Proposition HHH in 2016.

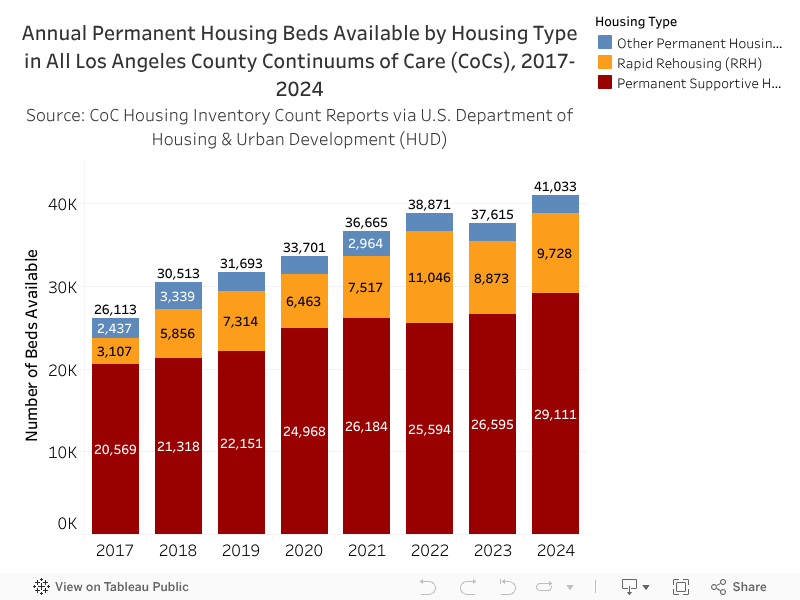
As of 2024, Los Angeles County16 has 41,033 permanent beds available for people experiencing homelessness.17 Of these, 29,111 (71%) are Permanent Supportive Housing (PSH), 9,728 (24%) are Rapid Rehousing (RRH), and 2,194 (5%) fall into other permanent housing categories outside of PSH and RRH. The current PSH inventory is split evenly between site-based and tenant-based beds.
Since 2017, the number of permanent housing beds available has increased by 57%. Between 2017 and 2024, the County added nearly 8,500 PSH beds (two-thirds of which were site-based) and over 6,600 RRH beds, shown in the chart below. During the same period, however, the number of people experiencing homelessness increased by more than 20,000 (see Houseless Angelenos chapter), highlighting the severity of the crisis.
Despite major housing investments, more people are falling into homelessness than the system can house. This reflects not only the limits of current housing capacity but also deeper structural drivers—stagnant wages, rising housing costs, and a weakening social safety net—that are pushing Angelenos into housing instability faster than permanent solutions can be built.
Contributors
- Authors
- Elly Schoen, USC Lusk Center for Real Estate
- Jared N. Schachner, USC Price School of Public Policy
- Jiaqi Dong, USC Lusk Center for Real Estate
- Cameron Yap, USC Lusk Center for Real Estate
- Research Team
- Devyani Ramamoorthy, USC Lusk Center for Real Estate
- Justin Culetu, USC Lusk Center for Real Estate
- Ramon Luquin, USC Lusk Center for Real Estate
- Elinor Amir-Lobel, USC Lusk Center for Real Estate
- Rediet Retta, USC Lusk Center for Real Estate
- Caroline Ghanbary, USC Lusk Center for Real Estate
- Joy Ndamukunda, USC Lusk Center for Real Estate
- Jiyoon Kim, USC Lusk Center for Real Estate
Citations
Baum-Snow, Nathaniel, and Lu Han. “The microgeography of housing supply.” Journal of Political Economy 132.6 (2024): 1897-1946.
California Department of Housing and Community Development. (2021). Southern California Association of Governments Regional Housing Need Determination. California Department of Housing and Community Development. Link
California Housing Partnership Committee. (2025). Los Angeles County 2025 Affordable Housing Needs Report. California Housing Partnership. Link
California State Legislature. (2016). Senate Bill No. 1069: Land use: housing: second units. Link
California State Legislature. (2019). Assembly Bill No. 68: Land use: accessory dwelling units. Link
California State Legislature. (2023). Assembly Bill No. 1033: Accessory dwelling units: separate conveyance. Link
City of Los Angeles. (2019). Ordinance No. 186481: Accessory dwelling units—Amendments to L.A. Municipal Code § 12.03, 12.22, 12.24, L.A.M.C. Ch. 1 regarding accessory dwelling units. Link
City of Los Angeles. (2017). Ordinance No. 184907: An ordinance adding Subdivision 10 to Section 14.00.A of Chapter 1 of the Los Angeles Municipal Code (Unpermitted Dwelling Units) (eff. May 17, 2017). Los Angeles Municipal Code § 14.00.A.10. Los Angeles City Clerk.
Colburn, G., Acolin, A., & Walter, R. (2025). Subsidy Overlaps in Federal Housing Policy. Housing Policy Debate, 35(3), 384–401. Link
Construction Coverage. (2025). U.S. Cities Building the Most New Housing [2025 Edition]. ConstructionCoverage.com. Link
Crandall, R. W. (2019, March 27). The U.S. economy: A brief overview and analysis of the current economic situation (CRS Report No. RL34591). Congressional Research Service. Link
Crane, Rebecca. (2020). Transforming Homeowners into Landlords: A Survey of Homeowners with Accessory Dwelling Units in Los Angeles. (Ziman Center Working Paper No. 2020-12). UCLA Anderson School of Management. Link
Gyourko, Joe, and Jacob Krimmel. “The impact of local residential land use restrictions on land values across and within single family housing markets.” Journal of Urban Economics 126 (2021): 103374.
Kim, A. M., & Eisenlohr, A. (2022). Community Land Trusts for Sustainably Affordable Rental Housing Redevelopment: A Case Study of Rolland Curtis Gardens in Los Angeles. Cityscape (Washington, D.C.), 24(1), 233–256.
Kung, Edward & Gabriel, Stuart. (2023). Tackling the Housing Crisis: Streamlining to Increase Housing Production in Los Angeles. Los Angeles Business Council. Link
Legislative Analyst’s Office. (2015, March 17). California’s high housing costs: Causes and consequences (Report No. 3214). California Legislative Analyst’s Office. Link
Los Angeles Housing Department. (2005). LADS Report on the Affordable Housing Trust Fund and Request for Authorization to Issue a Notice of Funding Availability for the Affordable Housing Trust Fund for Calendar 2006. Link
New York University Furman Center for Real Estate and Urban Policy. CoreData.nyc. Link
Owens, A., & Smith, R. B. (2023). Producing affordable housing in higher-opportunity neighborhoods: Incentives in California’s LIHTC program. Journal of Urban Affairs, 1–29. https://doi.org/10.1080/07352166.2023.2288582
Reina, V., & Williams, M. (2012). The Importance of Using Layered Data To Analyze Housing: The Case of the Subsidized Housing Information Project. Cityscape (Washington, D.C.), 14(1), 215–222.
Rosenhall, L., Karlamangla, S., & Nagourney, A. (2025, July 1). California Rolls Back its Landmark Environmental Law to Speed Housing Construction. The New York Times. Link
Southern California Association of Governments. (2021). SCAG 6TH CYCLE FINAL RHNA ALLOCATION PLAN. Link
Ward, J. M., Philips, S., & Manville, M. (2025, April 7). L.A.’s ‘mansion tax’ needs a remodel. Here’s how to fix it [Commentary]. RAND. Link
Ward, Jason & Schlake, Luke. (2025). The High Cost of Producing Multifamily Housing in California: Evidence and Policy Recommendations. RAND Corporation. Link
Footnotes
- Age refers to when the building was first constructed, not when it was remodeled, added to, or converted. Housing units built prior to 1939 are coded simply as “1939.” As a result, this measure is most useful for analyzing new housing construction over the past 85 years, rather than distinguishing among housing built in earlier periods (e.g 1800s).
- Data is current as of August 6, 2025. The accuracy of this data depends on what each jurisdiction reports. The California Department of Housing and Community Development (HCD) does not systematically verify these submissions, and smaller cities may have limited capacity or resources to track and report data consistently.
- Approximately 7% of owner-occupied properties in the HCD dataset reported demolishing at least one unit along with 1% of renter-occupied properties. In some cases, a new unit certified for occupancy may be replacing an existing unit and these “teardown” properties disproportionately skew towards the owner-occupied housing supply.
- This includes all households making less than half of area median income, encompassing both Extremely Low Income (ELI) and Very Low Income (VLI) households (e.g., for a household with three people, the household income is less than $56,750 in 2023).
- Low Income (LI) households are those making between 50% to 80% of Area Median Income (e.g., for a household with 3 people, the household income is between $56,750 and $90,850 in 2023).
- Excludes 7 mobile home units
- Above Moderate Income (ABMI) households are those making more than 120 percent of the LA County area median income (e.g., for a household with 3 people, the household income is $106,050 or more in 2023).
- The 6th RHNA Cycle spans from October 2021 to October 2029. This visualization includes data for the full calendar year of 2021 and should be interpreted as an estimate of progress toward each jurisdiction’s housing goals—not an exact or official measure. Affordability levels for both renter and owner-occupied units are shown.
- This analysis includes properties listed in the City of Los Angeles Housing Element APR that received a building permit between 2018 and 2021. This timeframe enables us to monitor the majority of projects through to completion (from building permit issuance to receipt of certificate of occupancy), as most projects permitted as late as December 2021 are expected to have obtained a certificate of occupancy by December 2024 (our last month of available data). For further details on methodology, refer to the Data & Methods appendix.
- Some of the properties can contain a few units for property managers. These units are not considered as assisted.
- Some of these properties and homes may be subsidized by other city programs, such as 421-a and 420-c tax exemptions, or other inclusionary zoning programs. It is important to note that New York City has the largest public housing stock in the nation.
- Including several developments that are under construction but not yet placed in service. For more information regarding the LIHTC program, please visit: https://la.myneighborhooddata.org/2021/06/low-income-housing-tax-credits-lihtc/
- Therefore, in the rest of the analysis, only the total number of residential units in different subsidized properties are reported in text and tables.
- Analysis is limited to neighborhoods with more than 1,000 rental units.
- Tenant-based vouchers could be used to lease units in some properties with a different subsidy attached to the unit (Colburn, Acolin, Walter, 2025). Therefore, it is advised to be careful about estimating the total number of subsidized households since a household could be in a housing unit with more than one subsidy.
- This analysis covers all four Continuums of Care (CoCs) in Los Angeles County. Each CoC is a regional planning body recognized by the U.S. Department of Housing and Urban Development (HUD) that coordinates housing and services funding for people experiencing homelessness within its jurisdiction.
Some of the PSH and RRH beds overlap with the subsidized property universe in the earlier section.
