Table of Contents
Key Insights
- Homelessness rose steadily in Los Angeles County for more than a decade, particularly among those who are unsheltered. This trend, however, has recently reversed – likely due to increased shelter availability and encampment resolution efforts.
- Unhoused people in Los Angeles County are more likely to be unsheltered and experience longer durations of homeless spells compared to unhoused people in other metropolitan areas.
- Black residents remain overrepresented among Los Angeles County’s unhoused population, and the number of Hispanic/Latino people experiencing homelessness has risen since the COVID-19 pandemic – a trend consistent with national patterns.
- A large and growing number of Angelenos live in cars, vans, or RVs as a primary form of shelter.
- The vast majority of unhoused Angelenos lived in Los Angeles County before they fell into homelessness, underscoring the deep connection between the region’s housing affordability and homelessness crises.
Los Angeles County has the nation’s largest unsheltered population —nearly one in five unsheltered people in the U.S. live in this region. After years of political and civic neglect of housing and homelessness, the past decade has seen homelessness rise to the top of the political and policy agenda. Starting in 2016, taxpayers began funding major investments in rehousing (see Supply chapter), outreach, and—more recently—health care. At the same time, the city and county have recently launched divisive programs that directly target unsheltered homelessness and encampments, including ordinances that ticket people for sleeping outside and “encampment resolution programs” that aim to create a pipeline from encampments to permanent housing.
Although more people experiencing homelessness in Los Angeles County are accessing shelter, most live unsheltered – in places not meant for human habitation, such as streets, parks, vehicles, or abandoned buildings. This means that the majority of LA’s unhoused population is particularly vulnerable, with no safe, stable place to escape inclement weather, natural disasters, disease, violence and victimization, or displacement through government “sweeps.” On average, roughly seven unhoused Angelenos die on the streets each day (LA County Department of Public Health).
Public debate about homelessness is often shaped by misconceptions about unhoused people and their experiences. This chapter, written in partnership with the Homelessness Policy Research Institute, uses data from the Los Angeles Homeless Count to present a more accurate picture. It traces changes over the past decade, explores the demographic and health characteristics of people experiencing homelessness, and highlights the geographic areas where unsheltered homelessness is most concentrated. Readers will come away with a deeper understanding of who is most affected, how conditions have shifted in recent years, and a brief look at emerging local efforts to address the crisis.
This chapter uses data from the annual Los Angeles Homeless Count, which is federally mandated by the U.S. Department of Housing and Urban Development (HUD).
- While earlier chapters look at patterns across all of Los Angeles County, this chapter focuses specifically on the Los Angeles County Continuum of Care (LA CoC)—the local system that coordinates housing and homelessness services for the entire county, excluding the cities of Glendale, Pasadena, and Long Beach, which operate their own separate Continuums of Care.
- This report uses HUD’s definition of homelessness, which primarily includes individuals lacking a fixed, regular, and adequate nighttime residence who are living in places not meant for human habitation (i.e., unsheltered) or living in emergency shelter. HUD’s definition excludes large numbers of people who are couch-surfing or “doubled up,” including many students and families that would be considered homeless by the U.S. Department of Education.
Recent Progress after a Decade of Rising Homelessness
In the LA CoC, homelessness rose sharply over the past decade—from 41,174 people on a single night in 2015 to a peak of 71,320 in 2023. By 2025, the estimate had fallen 5% to 67,777, marking the first significant drop in years. Still, this total remains higher than 2022 levels, and is large enough to fill every seat in Dodger Stadium with nearly 12,000 more people left outside. The chart below shows annual estimates of the sheltered and unsheltered population between 2015 and 2025 in the LA CoC.1
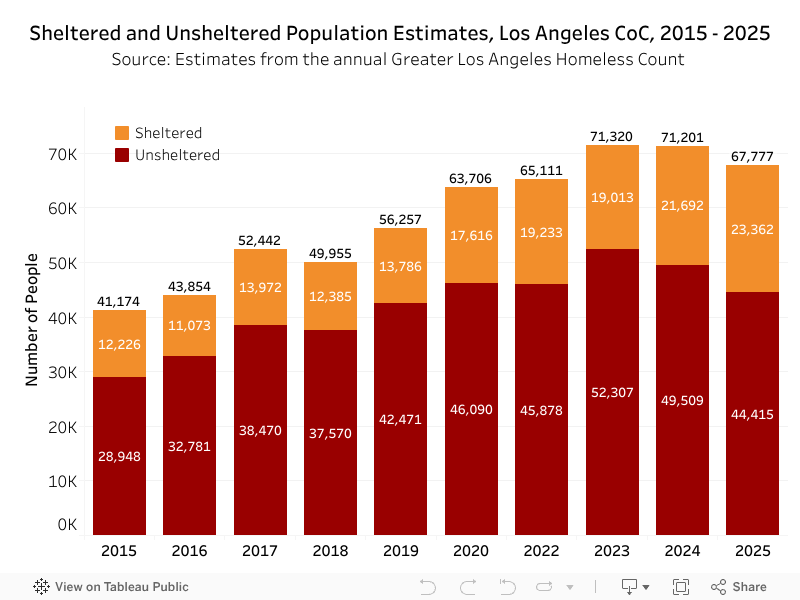
As shown in the chart above, the long-term growth in the homeless population through 2023 was fueled mainly by an increase in the unsheltered population, rather than those staying in emergency shelters. In 2023, the unsheltered population reached a peak of 52,307, an 81% increase from 28,948 in 2015. Since the unsheltered population’s peak in 2023, its size has declined by nearly 8,000 people to an estimated 44,415 unsheltered adults and youth living on the streets on any given night in 2025.
While the unsheltered population has decreased, the number of people accessing emergency shelters has reached a record high. As of 2025, 23,362 people were sleeping in emergency shelters on any given night, nearly double the number in 2015. Although 66% of all people experiencing homelessness remained unsheltered in 2025, this represents a significant decrease from 75% between 2016 and 2019.2 In addition to increased shelter availability, Los Angeles County has also implemented encampment resolution programs that may play a role in decreasing unsheltered homelessness.
Los Angeles has increasingly adopted “encampment resolution” programs—coordinated, multi-agency efforts to move encampment residents into interim and permanent housing with the goal of dismantling encampments and preventing their return (Benioff Homelessness & Housing Initiative).
- These programs are framed as more humane, service-oriented alternatives to police-led “sweeps,” which forcibly displace encampments without ensuring housing or supportive services.
- Encampment resolution has gained backing from Governor Newsom’s administration and the courts, who expanded local authority to enforce anti-camping laws. In Los Angeles, the City’s Inside Safe and the County’s Pathway Home lead this approach.
- Despite official claims that encampment resolution is distinct from punitive displacement strategies, community advocates and unhoused residents warn these programs can replicate the harms of sweeps under a different name.
- Critics also note that the supply of permanent housing remains far below demand, leaving many participants cycling through motels or interim placements without real progress toward stable housing.
The tension between the promise of housing-first approaches and the realities of limited housing stock, lack of operational transparency, and ongoing policing and displacement continues to shape the public debate around encampment resolution in Los Angeles.
Demographic Characteristics of Unhoused Angelenos
Even with modest declines in unsheltered homelessness, tens of thousands of Angelenos remain without stable housing, and the impacts are not evenly distributed. Longstanding inequities mean some groups bear a far greater share of the burden. The following section examines the demographic characteristics of people experiencing homelessness in Los Angeles County to better understand who is most at risk.
Black Angelenos Continue to Be Disproportionately Affected by Homelessness
According to 2023 Homeless Count data,3 Black Angelenos are overrepresented in the LA CoC’s unhoused population, making up 32% of people experiencing homelessness despite comprising just 7% of the county’s population. By contrast, non-Hispanic white people are underrepresented in the unhoused population (19%) compared to their share of the county population (25%). Rates of homelessness per 10,000 people are extremely high among American Indians/Alaska Natives, Native Hawaiian/Other Pacific Islanders, and Black/African Americans.
The chart below shows the racial/ethnic makeup of sheltered, unsheltered and all unhoused people in the Los Angeles CoC compared to the county’s population as a whole. Black people are overrepresented among the sheltered population, while white and Hispanic/Latino groups are overrepresented among the unsheltered.
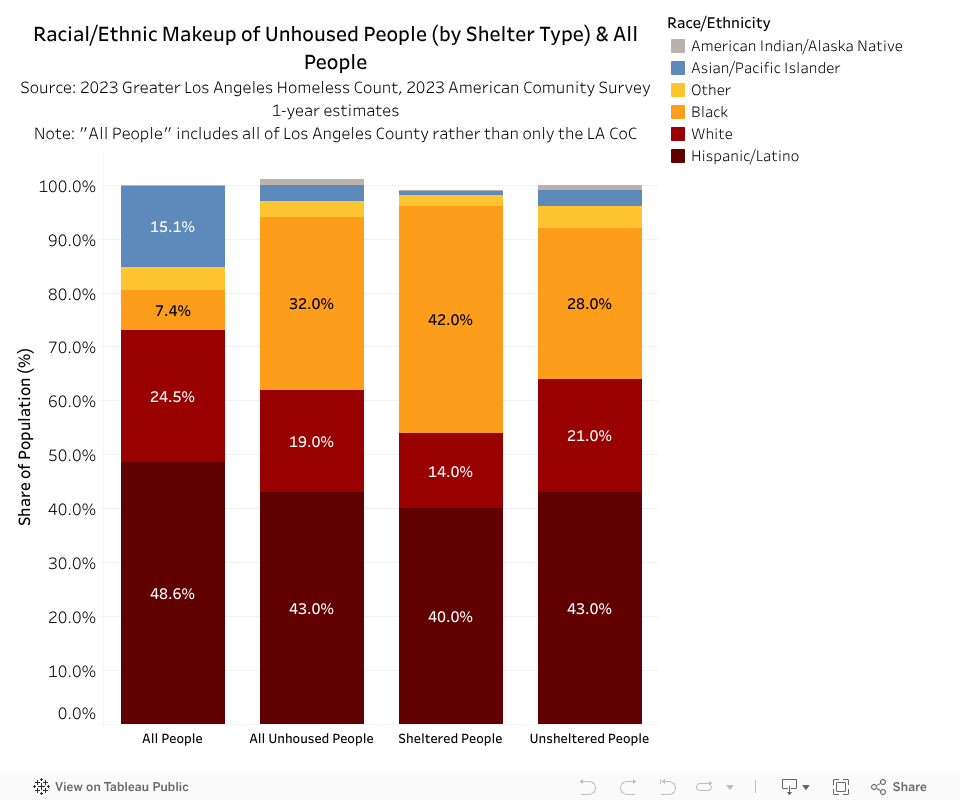
Note: Proportions may not add to 100% due to rounding. Sheltered and unsheltered populations include adults and youth (sheltered N = 21,692; unsheltered N = 49,509; Total N = 71,201).
Pandemic-Era Spike in Homelessness among Latinos
Historically, the Hispanic/Latino population has been underrepresented in the unhoused population, reflecting the so-called “Hispanic homelessness paradox”: selective immigration and return migration, along with strong family networks, help mitigate homelessness risk (Chinchilla, Moses, & Visotzky, 2023).
Following the COVID-19 pandemic, however, the share of Hispanic/Latino people experiencing homelessness increased by 32%. Despite this increase, Hispanic/Latino people made up a smaller share of the unhoused population (43%) than in the county as a whole (49%) in 2023. A recent study found that the post-COVID spike in Hispanic/Latino homelessness was associated with an increase in the number of working unhoused people and people living in vehicles (Delgado Garcia et al., 2024). Across all racial/ethnic groups, only White people experienced a decline in homelessness since 2020.
Men and Boys Account for Two-Thirds of the Unhoused
As shown in the chart below, the unhoused population predominantly consists of men and boys, who make up 65% of unhoused individuals in 2024. Men and boys are also more likely to be unsheltered, making up just under three-quarters of unsheltered individuals. By comparison, women and girls are much more likely to be living in emergency shelters, making up 44% of sheltered individuals compared to 27% of unsheltered people in 2024. Two percent of unhoused people reported other gender identities in 2024. The gender makeup of the houseless population has remained relatively unchanged since 2020.
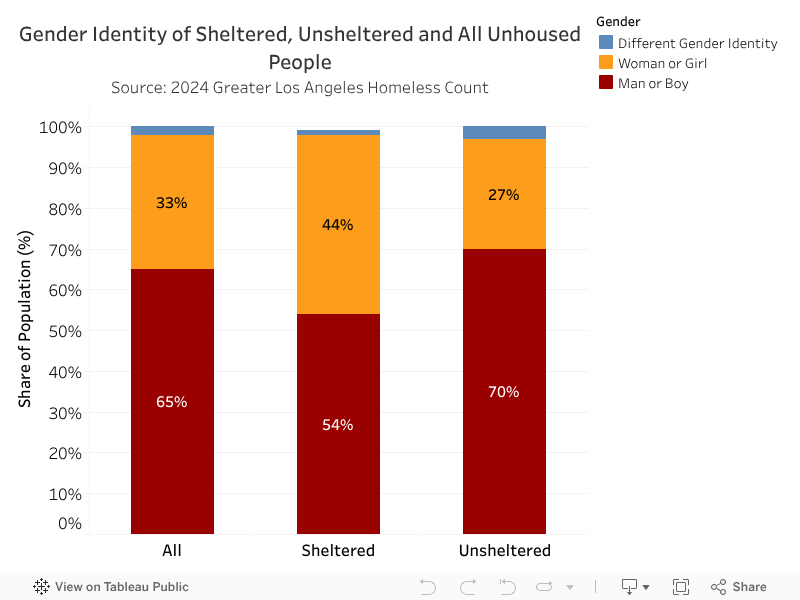
Note: Proportions may not add to 100% due to rounding. Sheltered and unsheltered populations include adults and youth (sheltered N = 21,692; unsheltered N = 49,509; Total N = 71,201).
Growing Numbers of Older Adults are More Likely to Be Unsheltered
Although much attention has been paid to the aging of the homeless population, unhoused people in the LA CoC are younger, on average, than the county population as a whole (see Population Characteristics chapter). However, the share of unhoused individuals who are older adults (age 62+) rose from 10% in 2020 to 14% in 2024. The chart below shows the age distribution of sheltered and unsheltered people in the LA CoC. Adults over the age of 55 are far more likely to be unsheltered, making up 30% of the unsheltered population compared to 18% of the sheltered population.
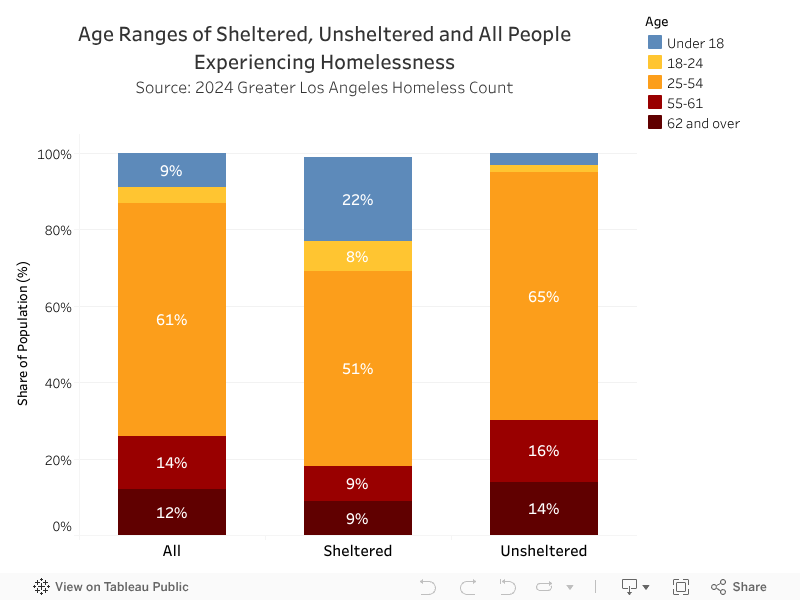
Note: Proportions may not add to 100% due to rounding. Sheltered and unsheltered populations include adults and youth (sheltered N = 21,692; unsheltered N = 49,509; Total N = 71,201).
Families with Children are Fewer and More Likely to Be Sheltered
The share of people experiencing homelessness who are living in families with children fell from 20% in 2020 to 15% in 2024, mirroring a broader decline in the number of families with children in Los Angeles County (see Population Characteristics chapter). As shown in the chart below, individuals in families with children are more likely to be living in emergency shelters than outside, accounting for 36% of the sheltered population compared to 6% of the unsheltered population in 2024. Although the rate of unsheltered homelessness in this population is relatively low, it translates to roughly 3,000 unsheltered individuals in families with children as of 2024.
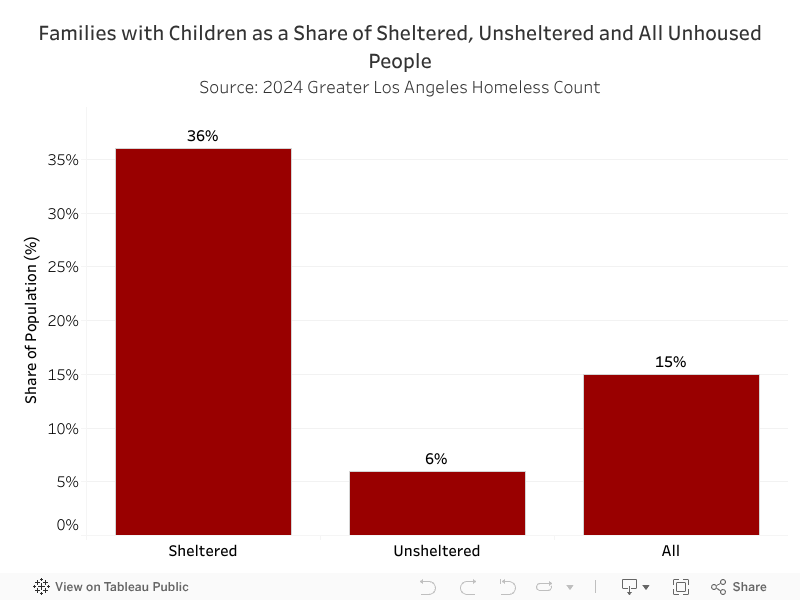
Note: The proportions reflect the share of estimated individuals living in families with children. Sheltered and unsheltered populations include adults and youth (sheltered N = 21,692; unsheltered N = 49,509; Total N = 71,201).
Many Unhoused Angelenos Live with Health Challenges
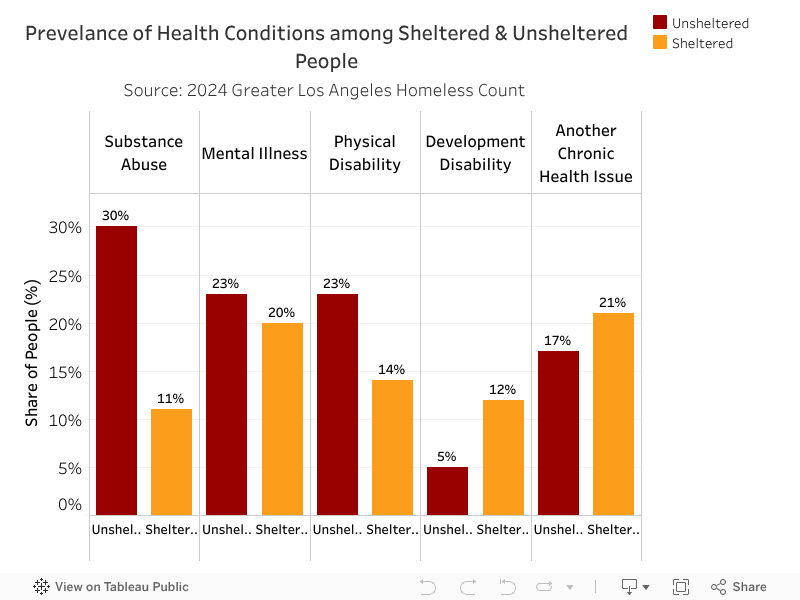
The LA Homeless Count tracks the general presence of physical health, mental health and substance use conditions across both sheltered and unsheltered people. People experiencing homelessness in Los Angeles County report high rates across all categories, with:
- 22% reporting mental illness
- 24% reporting substance abuse
- 20% reporting physical disability, and
- 7% reporting a developmental disability.
A common misconception is that most people experiencing homelessness have a mental illness or substance use disorder; while these rates are high, they represent a minority of the overall unhoused population.
As shown in the chart below, rates of most conditions were higher among unsheltered versus sheltered individuals, with particularly striking disparities in substance abuse (30% of unsheltered vs. 11% of sheltered individuals), and to a lesser extent in physical disability (23% of unsheltered vs. 14% of sheltered individuals). The latter difference underscores the need for more shelters that address accessibility barriers.4
A Deeper Dive into Unsheltered Homelessness
As part of the annual unsheltered homeless count, thousands of volunteers go out on a single night to canvass the 2,310 census tracts that make up the Los Angeles County Continuum of Care. They are asked to count:
- the number of people seen living on the streets;
- the number of vehicles appearing to be used for shelter; and
- the number of tents and makeshift shelters observed on the streets.
The graph below tracks trends in annual volunteer-generated counts across these three categories from 2018 through 2025. From 2018 through 2023, the number of vehicles and, to a lesser extent, the number of tents and makeshift shelters, steadily increased while the number of people seen on the streets remained relatively stable. Since 2023, the number of observations in each category has been decreasing, and vehicles now outnumber both tents and makeshift shelters as well as unsheltered individuals who are observed each year.
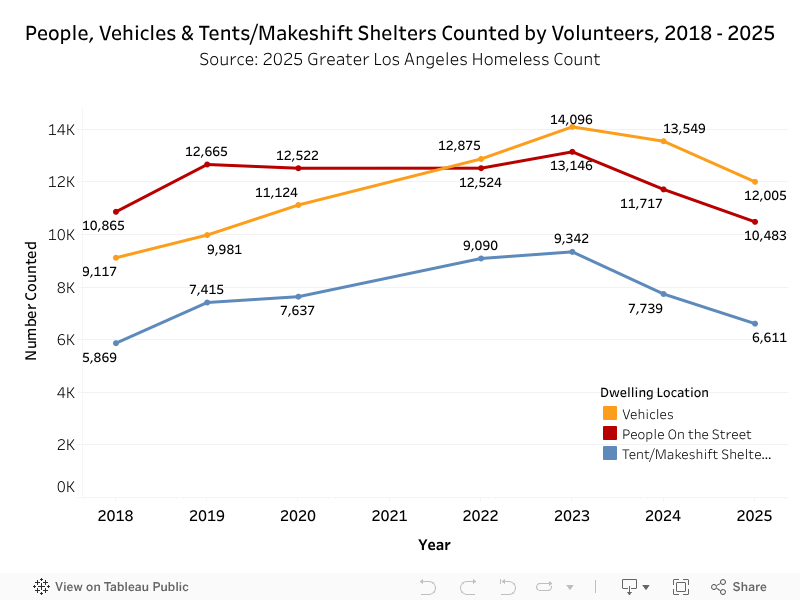
Note: Counts reflect the number of unsheltered adults (aged 25 and older) living on the streets and the number of vehicles, tents, and makeshift shelters counted, as recorded by volunteers, during the Los Angeles Continuum of Care Annual Homeless Count for each year.
To understand more about who is among the people living on the streets and in the vehicles, tents and makeshift shelters observed by volunteers, a separate survey is conducted with approximately 4,500 unsheltered individuals who are encountered in randomly selected census tracts from across the LA CoC over a 3-month period. The survey results challenge several popularized narratives about houseless Angelenos, including that many cycle in and out of homelessness due to substance abuse or that many moved from out of state to capitalize on living outdoors in a mild climate. This section explores the actual experiences of unsheltered people in Los Angeles County based on their survey responses.
Chronic Homelessness Rates Exceed National Average
In each of the last five years close to 80% of unsheltered survey respondents reported having been unhoused for over a year. In 2025, 37% reported being unhoused for more than 5 years consecutively. The chart below shows reported durations of homelessness among survey respondents in 2025.
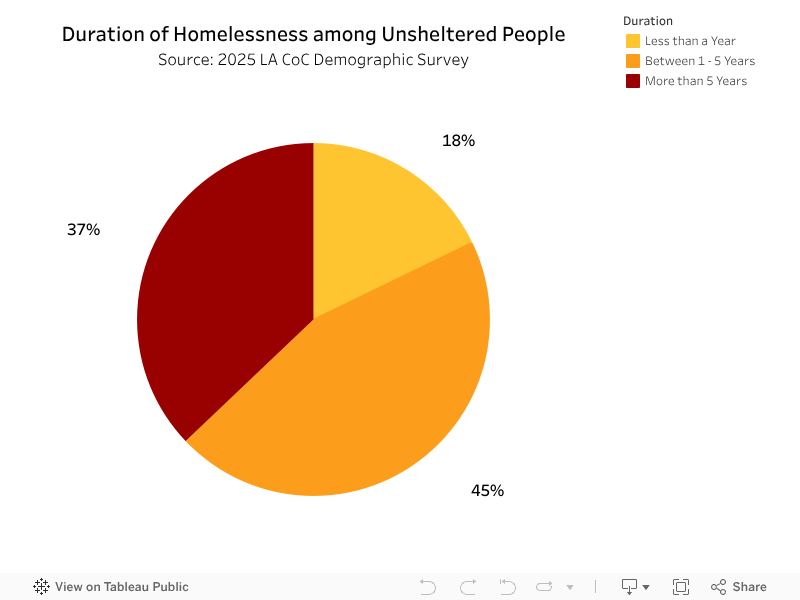
Chronic homelessness refers to long-term or repeated homelessness experienced by people with a disabling condition, such as a serious health issue or mental illness. In 2025, 49% of unsheltered individuals in the Los Angeles CoC were considered chronically homeless compared to 44% of unsheltered individuals nationally (de Sousa & Henry, 2024).
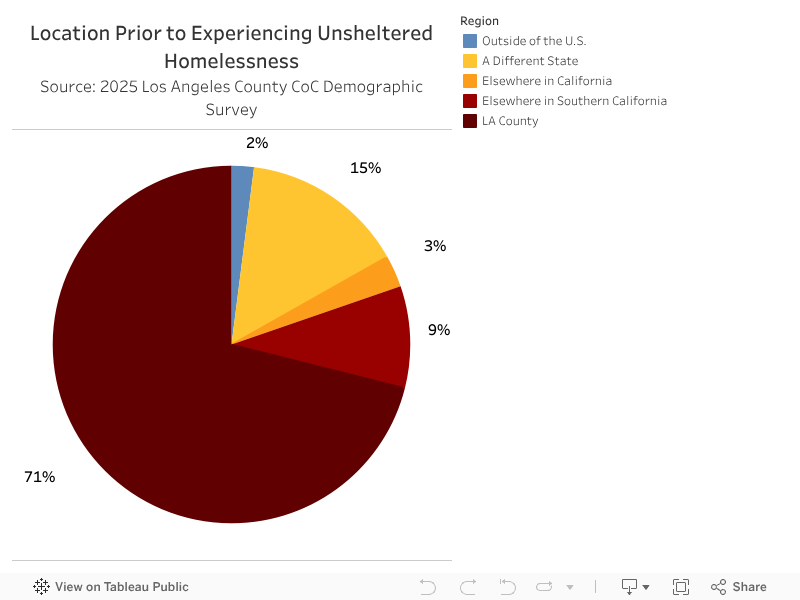
Most Unsheltered Angelenos were Most Recently Housed in LA County
Contrary to the common claim that most unhoused people come from other places in order to enjoy California’s warm weather or welfare benefits, most unsheltered individuals in Los Angeles County end up very close to where they were last housed. As shown in the chart below, in 2025, 71% of survey respondents reported living in Los Angeles County the last time they were housed, underscoring that homelessness in Los Angeles is rooted in the region’s deep affordability challenges. Just 2% of survey respondents were last housed outside of the U.S., a share that has not increased over time.
Most Unsheltered Residents Live in a Handful of Neighborhoods
The map below shows the uneven distribution of unsheltered homelessness across neighborhoods within the Los Angeles County CoC in 2020 and 2025. In both time periods, about 25% of the county’s unsheltered population is concentrated in Service Planning Area 4, which includes Downtown, Hollywood and Skid Row. Other significant concentrations are in South LA and beach communities on the Westside of LA, patterns that have remained remarkably consistent from year to year. These spatial distributions broadly align with the distributions of renters, and even more so of rent-stressed households identified in earlier chapters.
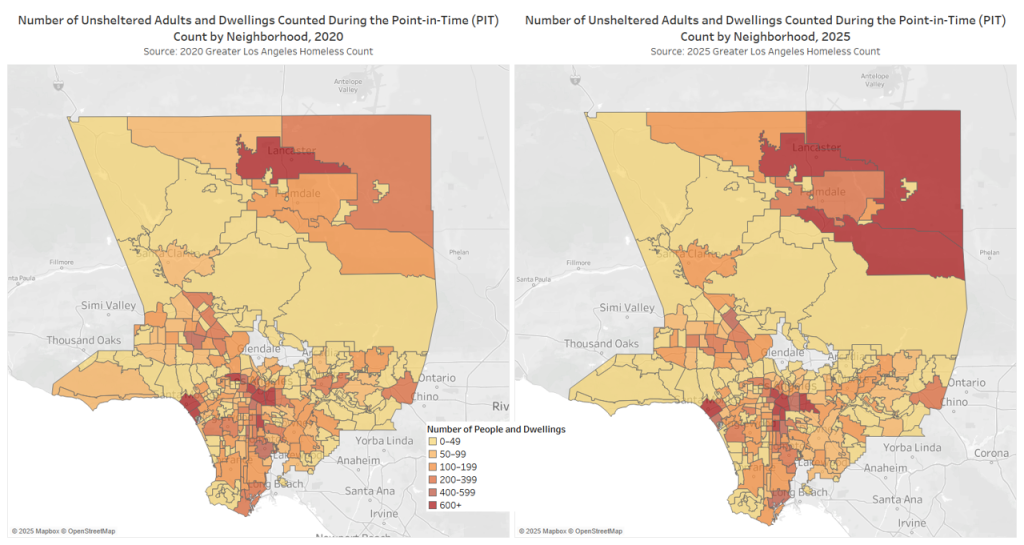
Note: The maps display PIT counts of unsheltered individuals (aged 25 and older) and cars, vans, RVs, tents, and makeshift shelters recorded by volunteers for each year by Los Angeles County neighborhoods.
Contributors
- Authors
- Randall Kuhn, UCLA Fielding School of Public Health
- Benjamin Henwood, USC Center for Homelessness, Housing and Health Equity Research
- Amanda Landrian Gonzalez, USC Center for Homelessness, Housing and Health Equity Research
- Jared N. Schachner, USC Price School of Public Policy
- Elly Schoen, USC Lusk Center for Real Estate
- Research Team
- Jessie Chien, UCLA California Center for Population Research
- Patricia St. Clair, USC Schaeffer Center for Health Economics and Policy
- Scot Hickey, USC Center for Homelessness, Housing and Health Equity Research
- Stephanie Kwack, USC Center for Homelessness, Housing and Health Equity Research
- Justin Culetu, USC Lusk Center for Real Estate
Citations
Chinchilla, M., Moses, J., & Visotzky, A. (2023, January 24). Increasing Latino homelessness—What’s happening, why, and what to do about it. National Alliance to End Homelessness & Homelessness Research Institute. Link
Delgado Garcia, M. A., Chinchilla, M., Henwood, B., Chien, J., Kwack, S., & Kuhn, R. (2024, July). Latino‑Hispanic unsheltered homelessness before and after COVID‑19. American Journal of Public Health, 114(Suppl. 6), S510–S514. https://doi.org/10.2105/AJPH.2024.307717
de Sousa, T., & Henry, M. (2024, December). The 2024 Annual Homelessness Assessment Report to Congress: Part 1—PIT estimates of homelessness in the U.S. U.S. Department of Housing and Urban Development. Link
Los Angeles County Department of Public Health. (2025). Mortality rates and causes of death among people experiencing homelessness in Los Angeles County: 2017–2023 (Homeless Mortality Report 2025). Link
University of California, San Francisco, Benioff Homelessness & Housing Initiative. (2024, September 12). Encampment resolution guide. Link
Footnotes
- Sheltered counts and unsheltered estimates reflect the total among adults and youth.
- Because the unsheltered numbers are estimates (unlike the sheltered numbers, which are actual counts), there is a margin of error associated with the unsheltered estimates, which in 2025 was about +/- 2%.
- Starting in 2024, there were adjustments in how Race and Ethnicity were defined.
- To view more detailed metrics of specific health outcomes for sheltered and unsheltered populations, visit the Periodic Assessments of Trajectories of Housing, Homelessness and Health (PATHS) survey page at https://www.paths.la/.
