Table of Contents
Key Insights
- Los Angeles County is the most populous U.S. county; its growth in the late 20th century was fueled largely by immigrants who recently arrived in the United States.
- Since 2015, Los Angeles County has lost more than 500,000 residents. Population loss began before the pandemic and accelerated afterward, occurring alongside other demographic shifts, including a shrinking foreign-born population and a steep drop in the number of young people.
- At the same time, the number of households has been gradually increasing, as the makeup of households shifts toward fewer families with children and more individuals living alone.
Once a fast-growing hub for newly arrived immigrants and families, Los Angeles County is now experiencing steady population decline. This chapter traces that shift—from decades of population growth to more recent losses—and examines how the age and household composition of the county’s residents is changing. This evolution calls for housing policy and planning that respond to the realities of who the county is building for and how to meet the needs of its changing population.
Decades of Population Growth & Recent Declines
Historic Population Growth Fueled by Newly Arrived Immigrants
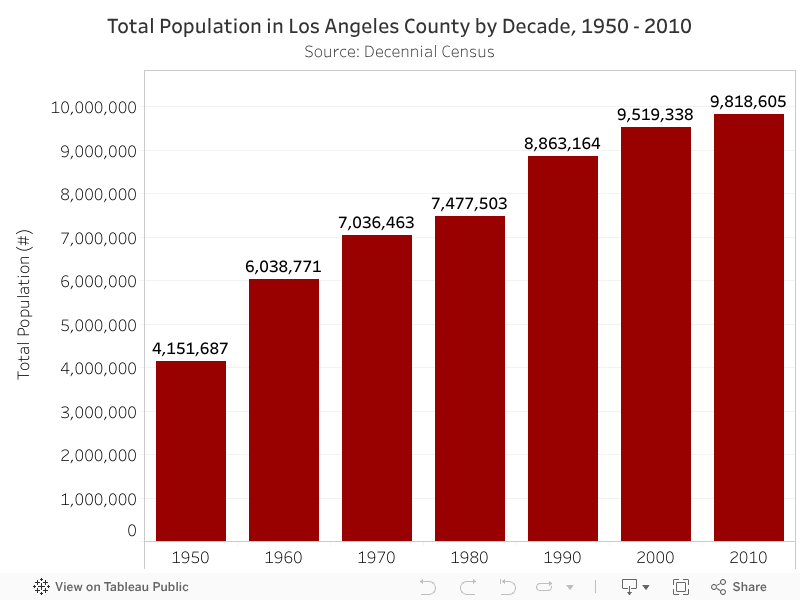
In the 1960 Census, Los Angeles County reached a population of 6 million—following a gain of nearly two million residents during the 1950s—and surpassed Cook County, Illinois, to become the most populous county in the United States. It has remained so ever since; today, Los Angeles County’s population is nearly double that of Cook County, which remains the nation’s second most populous county. The chart below shows the population recorded in each Census from 1950 to 2010.
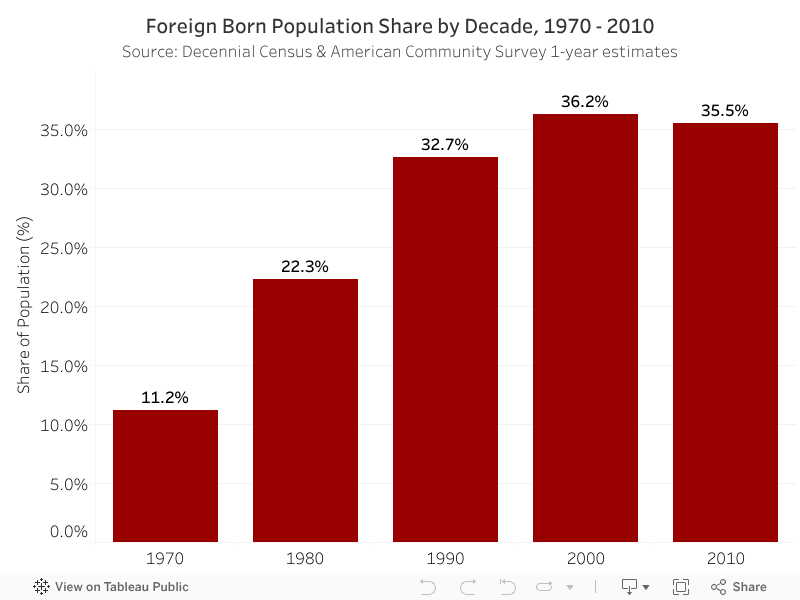
Much of Los Angeles County’s population growth from 1970 to 2000 was driven by recently arrived immigrants1 (Myers & Park, 2005). As shown in the chart below, by 2000, 36% of Los Angeles County’s population was born outside of the U.S., up from 11% in 1970. After 2000, growth in both the foreign-born and total population slowed. In 2015, the county’s population peaked at 10.17 million people.
Recent Population Declines Accelerated by the Pandemic
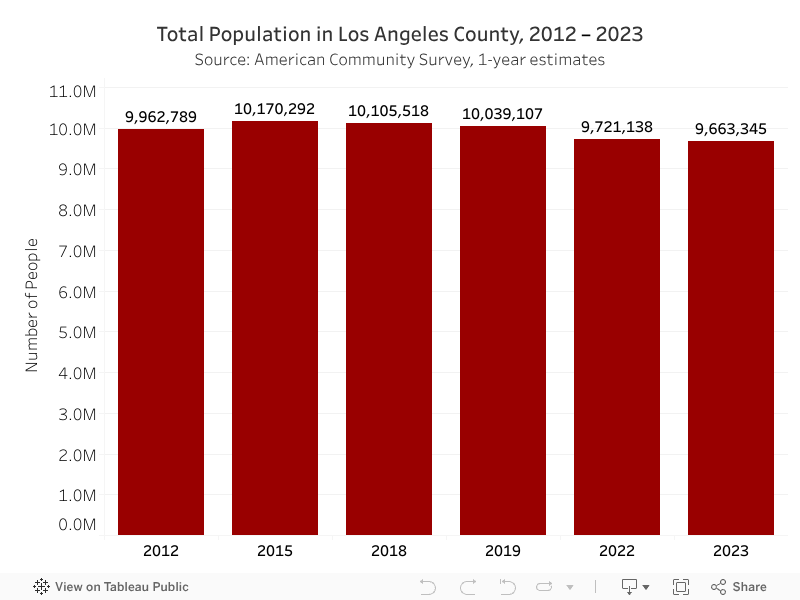
After peaking in 2015, Los Angeles County’s population fell to 9.66 million in 2023, a decrease of nearly 507,000 people (5%). As shown in the chart below, this decline began gradually but accelerated during and after the pandemic. From 2019 to 2023, the county lost 375,800 residents—three-quarters of the total decline since 2015. The City of Los Angeles’ population loss patterns mirrored those of the broader county. The city experienced a 5% population decrease (179,000 people) since 2017, the vast majority of which occurred after the onset of the pandemic. Statewide drops were less severe; California lost 1% of its population between 2018 and 2023.2 Los Angeles is losing population at a faster rate than both the state and the nation—despite growth being historically low across the country.
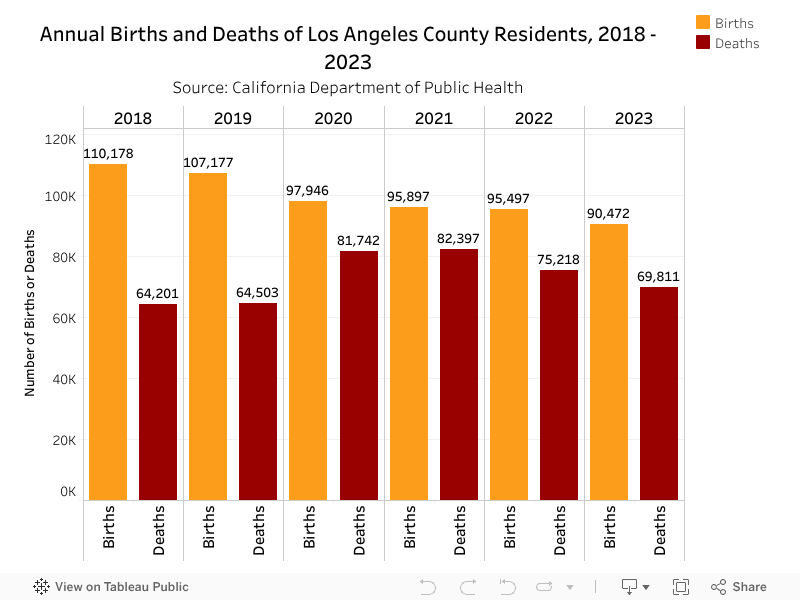
In Los Angeles County, both declining births and increasing deaths have contributed to population loss in recent years. In 2018, there were nearly 46,000 more births than deaths in Los Angeles County. By comparison, births exceeded deaths by just 20,700 in 2023 (California Department of Public Health). The chart below shows the number of births and deaths of Los Angeles County residents from 2018 to 2023. The county’s fertility rate is lower than the California average, and the state as a whole ranks among the lowest in the nation for fertility (California Department of Public Health, Centers for Disease Control). While the number of deaths in Los Angeles County fell in 2022 and 2023 after peaking during the pandemic, they have not returned to pre-pandemic levels.
Another factor in Los Angeles County’s recent population loss is residents leaving the region. Like other major cities, the Los Angeles metro area3 experienced a large increase in out-migration during the pandemic. A 2024 Brookings report examined tax records and found that twice as many people left the Los Angeles metro area in 2021 as in 2019, with Riverside, California being the most common destination (Brookings).
Decreasing Foreign-Born Population
Another factor contributing to population loss in Los Angeles County is a decrease in the foreign-born population. The size of the foreign-born population in Los Angeles County decreased each year from 2015 to 2022, with substantial losses during the pandemic (shown in the chart below). Although the foreign-born population rebounded slightly in 2023, there are nearly 280,000 fewer foreign-born residents than in 2015, a decrease of 8%. Over the same time period, the size of the U.S.-born population in Los Angeles County declined more gradually (-3%).
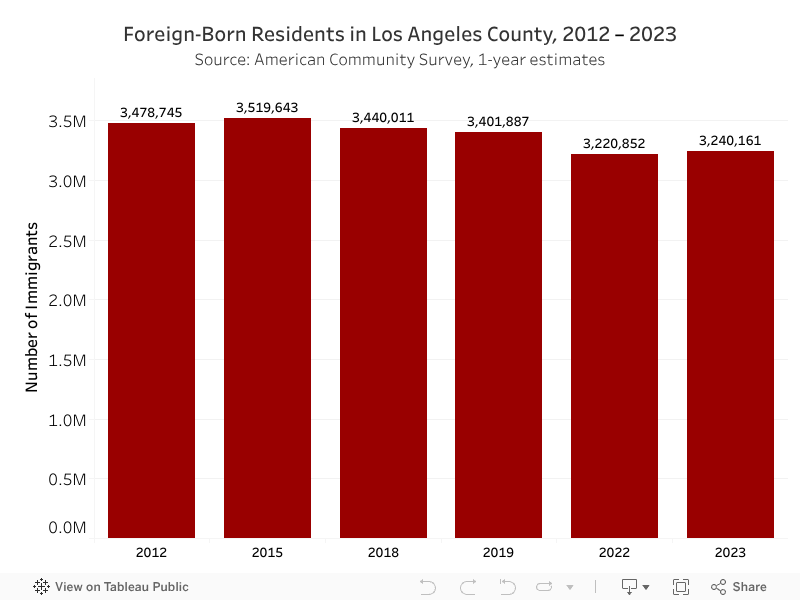
Despite population decrease in recent years, foreign-born residents still make up about a third of Los Angeles County’s population compared to just 14% of the national population in 2023. 55% of Los Angeles County’s foreign-born population are naturalized citizens, up from 46% in 2010.
Shifting Age Demographics
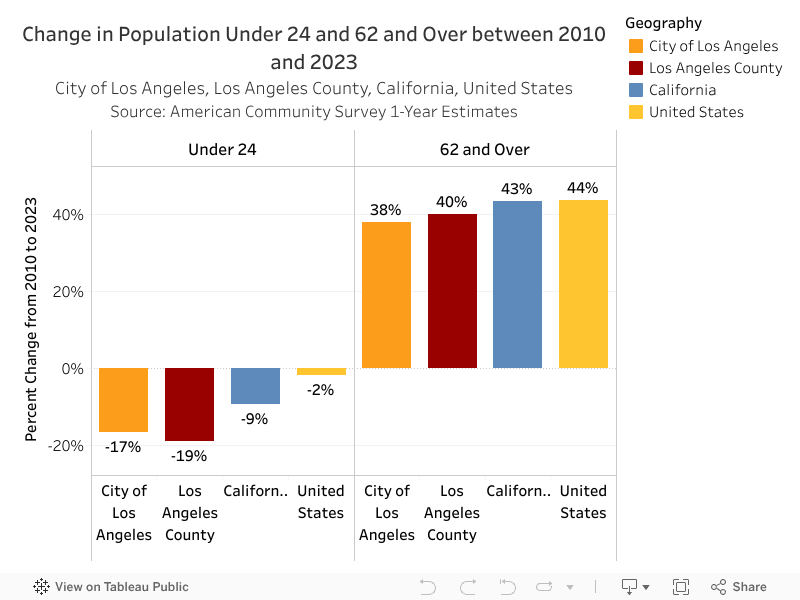
The share of young people in Los Angeles County is declining at a much faster pace than the national average. As of 2023, just 29% of the population was under the age of 24—down from 35% in 2010. That represents 660,600 fewer young people over the last 13 years. While this age group is shrinking nationally, Los Angeles County’s under-24 population has declined at a rate of 19%, far faster than the national average of 2%.
As the Baby Boomer generation continues to age, the number of people of retirement age has risen both across the country and in Los Angeles County. In 2023, 19% of Los Angeles County residents were age 62 or older—up from 14% in 2010. This represents an increase of nearly 535,000 people (40%) since 2010. Nationally, the 62+ population grew by 44% over the same period.
The chart below compares these shifts in age composition from 2010 to 2023 across the city, county, state, and nation.
Changing Household Composition
Increasing Number of Households
Although Los Angeles County lost over 500,000 residents between 2015 and 2023, it added nearly 157,400 households (5%) over the same period. Since 2015, the number of homeowner households has increased by 80,900 (5%), while the number of renter households has grown by 76,500 (4%).
Nationally, a similar pattern of household growth was driven by the formation of new households among millennials, many of whom were forced to delay living independently from their parents thanks to the Great Recession (2023 State of the Nation’s Housing).
More Households Have Just One Resident—Especially in LA City
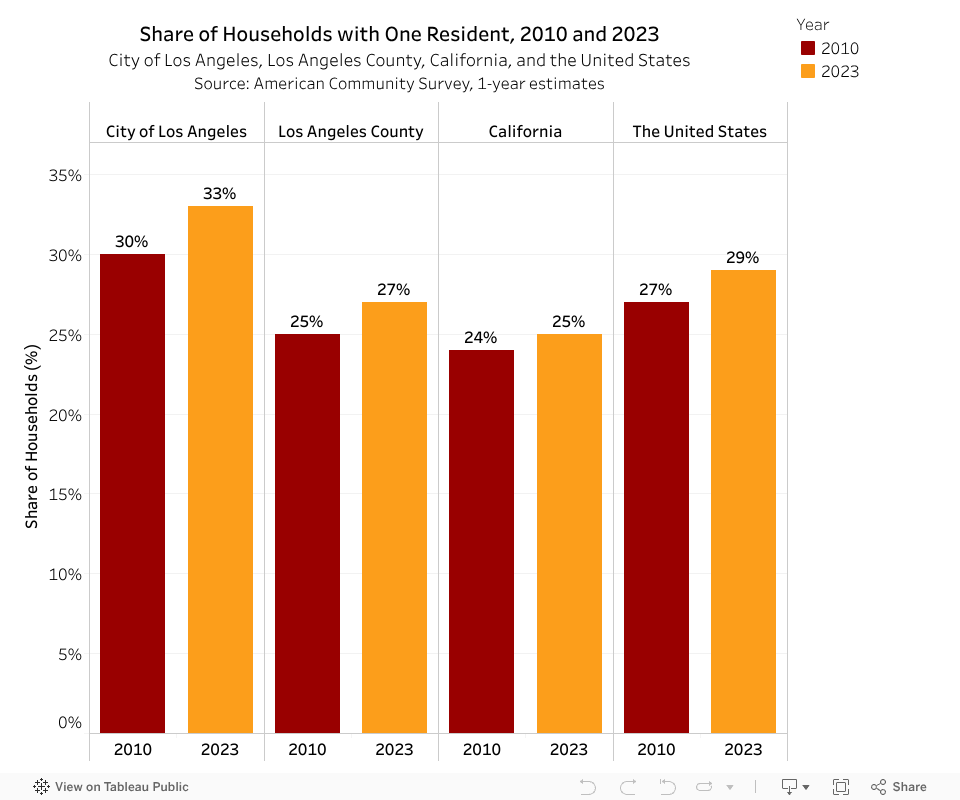
Single-person households are growing across the nation, and Los Angeles is no exception. Between 2010 and 2023, the share of one-person households increased in Los Angeles County, the City of Los Angeles, California, and the United States. Yet despite this growth, single-person households remain less common in Los Angeles County (27%) than they are nationally (29%).
Notably, the City of Los Angeles stands apart from the county on this measure, with 33% of households consisting of one person in 2023—higher than the national average and growing faster than in the county, state, or nation. The chart below depicts the share of one‑person households in 2010 and 2023 across Los Angeles County, the City of Los Angeles, California, and the U.S.
While single-person households are becoming more common, households with children4 are on the decline—especially in Los Angeles County.
Fewer Families with Children
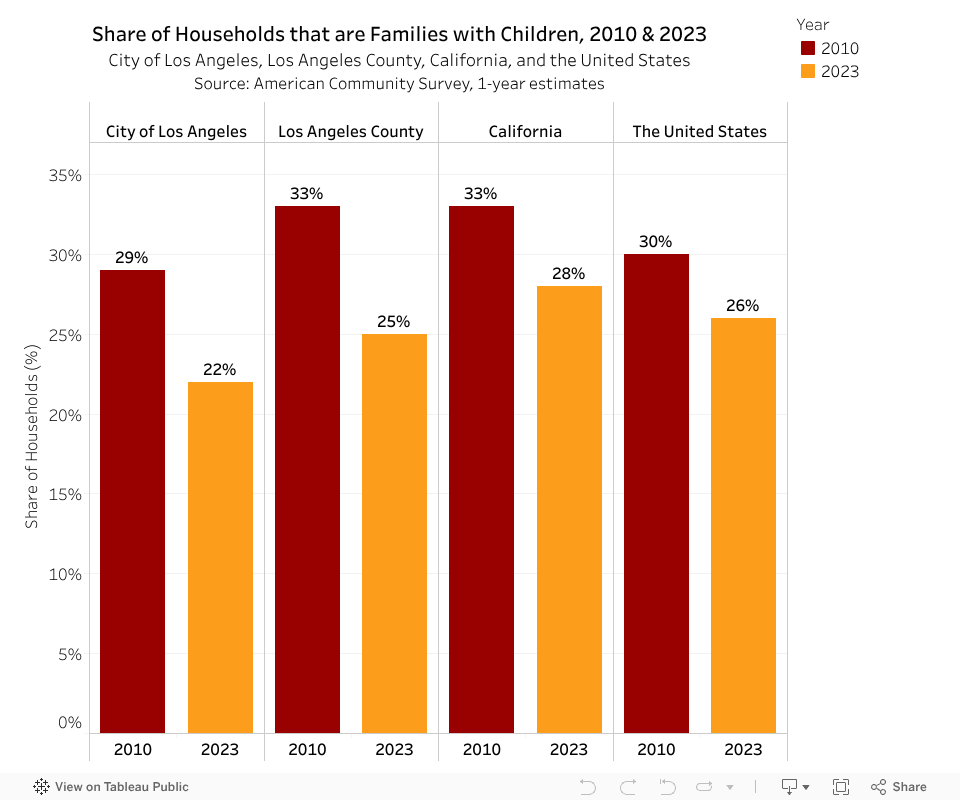
In 2010, both Los Angeles County and California as a whole had a higher share of households with children (33%) than the national average (30%), while the City of Los Angeles was just below (29%). Over the past decade, households with children have become less common across the U.S., in part due to declining fertility rates (CDC). However, the decline has been steeper in Los Angeles County than in both the state and the nation.
By 2023, just 25% of households in Los Angeles County were families with children—falling below the national average of 26% and even further behind the California average of 28%. The City of Los Angeles saw a similar decline and remains below the county average, with just 22% of households including children in 2023. Whether due to fewer new families forming or existing families being priced out, Los Angeles County can no longer claim a higher concentration of families with children than the national average.
The chart below shows the share of families with children in 2010 and 2023 across Los Angeles County, the City of Los Angeles, California, and the U.S.
Contributors
- Authors
- Elly Schoen, USC Lusk Center for Real Estate
- Jared N. Schachner, USC Price School of Public Policy
- Research Team
- Cameron Yap, USC Lusk Center for Real Estate
- Devyani Ramamoorthy, USC Lusk Center for Real Estate
- Justin Culetu, USC Lusk Center for Real Estate
- Elinor Amir-Lobel, USC Lusk Center for Real Estate
Citations
Berube, A. (2024, September 6). How the pandemic changed—and didn’t change—where Americans are moving. Brookings. Link
California Department of Public Health. (n.d.). Births [Maternal, Child & Adolescent Health Division]. Retrieved July 28, 2025. Link
California Department of Public Health. (n.d.). California Vital Data (Cal‑ViDa) query tool [Research and Analytics Branch]. Retrieved July 28, 2025. Link
Centers for Disease Control and Prevention. (2023, September 27). Fertility rates: National and state estimates. National Center for Health Statistics. Link
Centers for Disease Control and Prevention. (2024, May 25). Press release: Birth rates decline in the U.S., especially among teens. National Center for Health Statistics. Link
Joint Center for Housing Studies of Harvard University. (2023). The State of the Nation’s Housing 2023. Link
Myers, D., Park, J., & Ryu, S. (2005). Dynamics of Immigrant Settlement in Los Angeles: Upward Mobility, Arrival, and Exodus. University of Southern California. Link
Footnotes
- “Immigrants” and “foreign-born residents” refer to people born outside of the United States and the terms are used interchangeably throughout the chapter.
- 2023 is the latest year of data available from the Census Bureau. The California Department of Finance projects that population numbers rebounded slightly in Los Angeles and the State of California in 2024.
- The Los Angeles-Long Beach-Anaheim Metropolitan Statistical Area (MSA) includes both Los Angeles County and Orange County.
- “Households with Children” and “Families with Children” are used interchangeably throughout this section. They both refer to households with a child under the age of 18 who is related to the head of household (by marriage, adoption or birth) living in the home.
