Advancing a Collaborative Agenda in Southeast LA
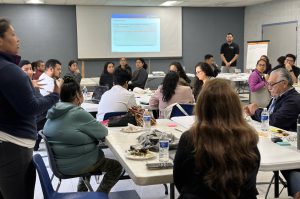
Advancing a Collaborative Agenda in Southeast LA In 2022, the California Community Foundation (CCF) launched the Regional Recovery Hub to strengthen place-based coordination in Los Angeles County
Advancing a Collaborative Agenda in Southeast LA In 2022, the California Community Foundation (CCF) launched the Regional Recovery Hub to strengthen place-based coordination in Los Angeles County
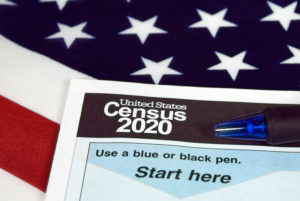
Every ten years, the federal government conducts a “census,” where it counts every person living in the United States. The constitution mandates that all people
Our nation’s population is aging and will continue to grow older over the next several decades. There are currently 49.2 million people ages 65 and
