Stability & Affordability
KEY INSIGHTS
- Accounting for inflation, typical home values in the USC Area have increased by over 140% over the last two decades.
- Ellis Act Evictions increased substantially in the USC Area starting in 2018 compared to the city average
- Rates of 911 Calls about landlord/tenant disputes in the USC Area have been consistently higher than the City average, and they have been concentrated in the Southwest corner of the neighborhood
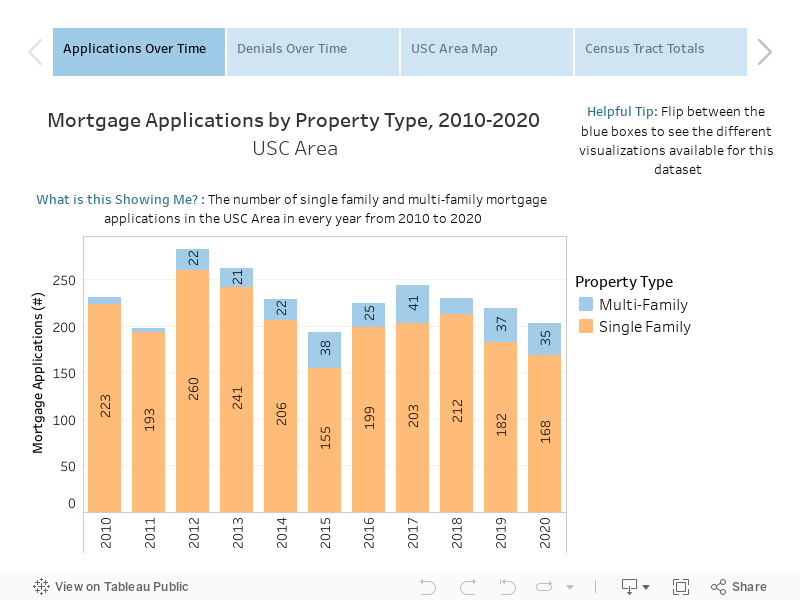
- Starting in 2012, mortgage applications for multi-family properties tripled in the USC area, although single family properties still made up the vast mast majority of mortgage applications in every year over the last decade.
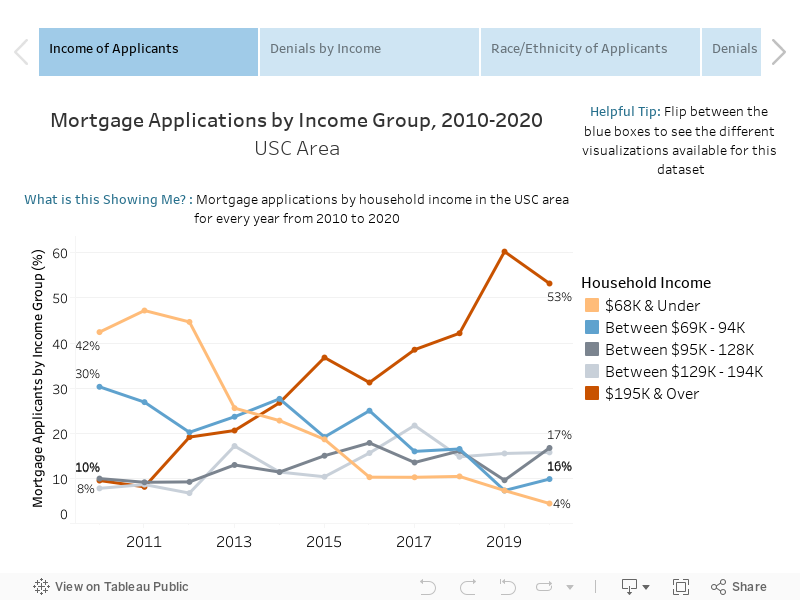
- The average income of mortgage applicants in the USC Area has increased substantially over the last decade.
- The share of mortgage applications from Latino/a households in the USC Area has decreased since 2010, while mortgage applications from white and Asian households have increased.
- Black households have experienced higher rates of mortgage application denials than any other racial/ethnic group since 2010, and applications from Black households were denied at higher rates in the USC Area than the Citywide average.
Typical Home Value
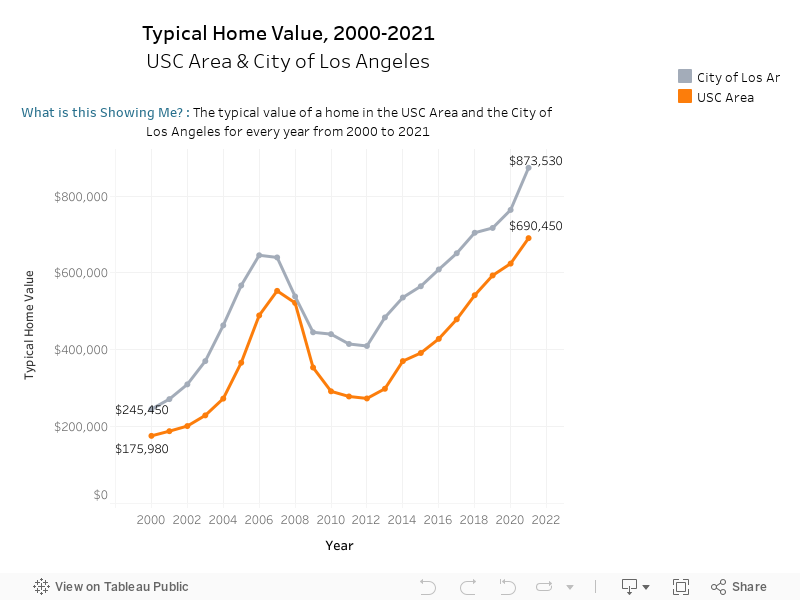
Key Takeaways
- Without accounting for inflation, typical home values in the USC area have increased nearly 300% over the last two decades, from just under $176,000 in 2000 to approximately $690,450 in 2021. (When inflation is taken into account, typical home values in the area have increased by just over 140% over the last two decades.)
- Typical home values have risen steadily in both the USC Area and the larger City of Los Angeles since 2012.
VARIABLE DEFINITION
Typical Home Value: A smoothed, seasonally adjusted measure of the dollar value for single-family homes, condos and co-ops in the area.
DATA SOURCE
Zillow
DATA NOTES
More About Typical Home Value: Typical home data is calculated using Zillow’s Home Value Index (ZHVI) for single family homes, condos and co-ops. The ZHVI is “A smoothed, seasonally adjusted measure of the typical home value and market changes across a given region and housing type. It reflects the typical value for homes in the 35th to 65th percentile range.” Learn more about the ZHVI here.
Zillow publishes the ZHVI for cities and zipcodes across the United States each month. In this graph, the typical home value shown for each year is an average of the 12 monthly data points published by Zillow for each year. The USC area is an average of the data from zip codes 90007 and 90037 (Zip code 90089 is not included in Zillow’s data as it largely contains USC’s campus). Dollar amounts have not been corrected for inflation (i.e. 2007 data is shown in 2007 dollars, 2008 is shown in 2008 dollars and so on). Annual data is rounded to the nearest ten for ease of viewing.
Ellis Act Evictions
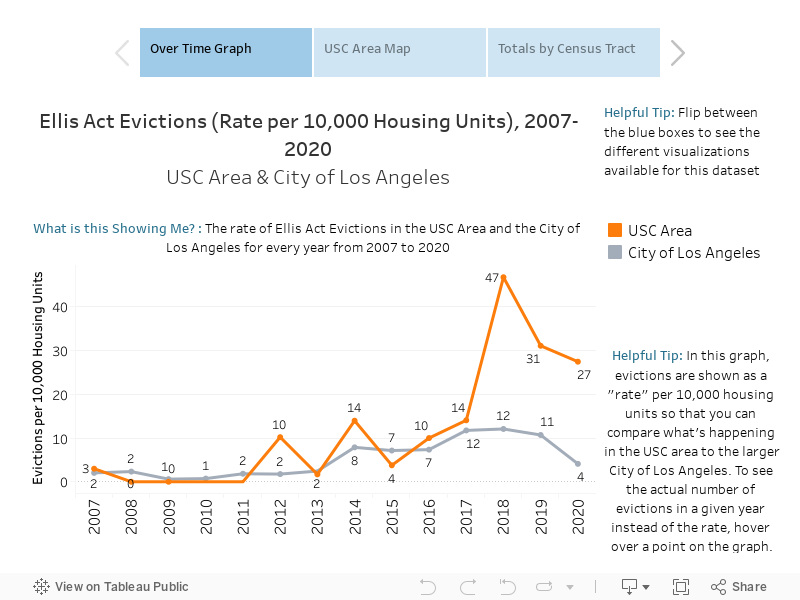
Key Takeaways
- Ellis Act Evictions have been rising in both the USC Area and across the entire City of Los Angeles in recent years
- Starting in 2018, Ellis Act Evictions in the USC Area increased substantially compared to the City average
- Ellis Act Evictions are concentrated in specific parts of the USC Area neighborhood. Residents in Census Tract 2226 (directly west of USC Campus) has experienced the highest number of Ellis Act Evictions (86) since 2007 .
911 Calls: Landlord Tenant Disputes
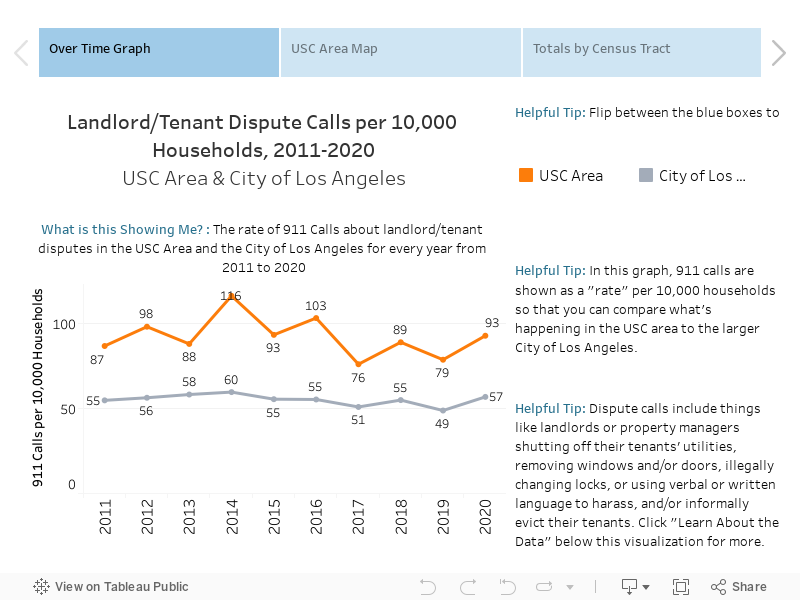
Key Takeaways
- Between 2011 and 2020, 911 Calls regarding Landlord/Tenant Disputes have been consistently higher in the USC Area than the City of Los Angeles as a whole.
- Landlord/Tenant Dispute Calls are concentrated in specific parts of the USC Area neighborhood. The Southwest Corner of the neighborhood has experienced the most total calls (241) since 2011.
VARIABLE DEFINITION
Landlord-Tenant Dispute Calls (count): The total number of 911 calls regarding landlord-tenant disputes in an area
Landlord-Tenant Dispute Calls per 10,000 People: The total number of 911 calls for landlord-tenant disputes per 10,000 people in an area
DATA SOURCE
Los Angeles Police Department (LAPD)
DATA NOTES
More About Landlord-Tenant Dispute Calls: This data may include events where landlords or property managers shut-off their tenants’ utilities, remove their tenants’ windows and/or doors, illegally change their tenants’ locks, and illegally remove services such as parking or access to shared space; this also includes other instances where landlords or property owners may use verbal or written language to harass, and/or informally evict their tenants. Lastly, these calls may also include landlords calling the police on tenants, which may be another form of harassment in and of itself.
Multi-Family Mortgages
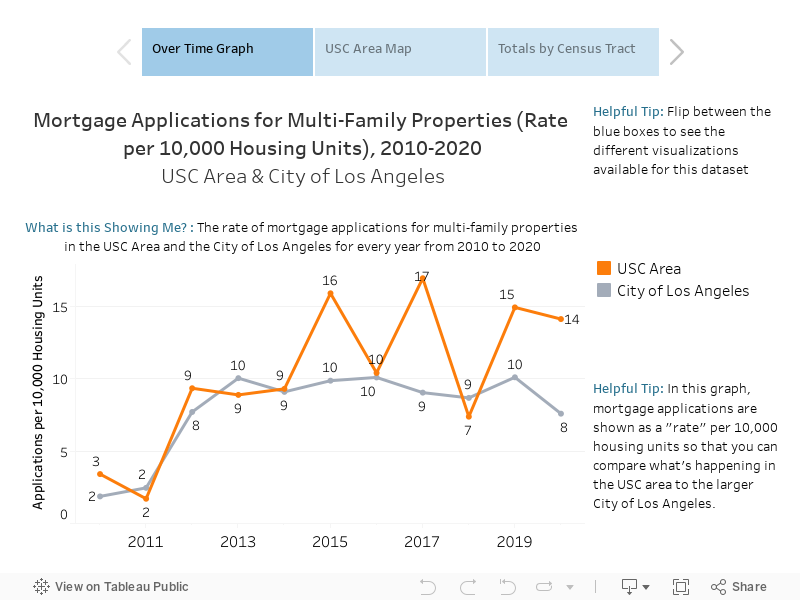
Key Takeaways
- Starting in 2012, mortgage applications for multi-family properties tripled in both the USC Area neighborhood and the larger City of Los Angeles.
- The USC Area neighborhood has had a higher rate of mortgage applications for multi-family properties than the Citywide average in four out of the last six years.
- Multi-family mortgage applications have been spread throughout various pockets of the USC neighborhood each year. Census Tract 2226 (directly West of USC’s Campus) has had the most applications (25) over the last decade.
VARIABLE DEFINITION
Multi-Family Mortgage Applications (count): The number of mortgage loan applications to financial institutions for multi-family properties in an area
Multi-Family Applications per 10,000 Units: The number of multi-family mortgage loan applications per 10,000 housing units in an area
DATA SOURCE
Home Mortgage Disclosure Act (HMDA), Consumer Financial Protection Bureau
DATA NOTES
More About Mortgage Applications for Multi-Family Properties: Multi-family mortgages are loans that an individual, family, or real estate entity borrows from a financial institution in order to pay for the development of a property that houses more than one family. An individual or corporation needs to make regular payments to pay-off the principal cost or the loan, and then they also need to pay for the interest of the loan that accumulates over time. While single-family mortgages are more likely to be associated with applications by residents, multi-family mortgages are more likely to be associated with applications by landlords, trusts, or real estate corporations. These loans most often cover a larger amount of money, and have shorter life years than single family mortgages.
Single Family Mortgages
Key Takeaways
- Although mortgage applications for multi-family properties have been increasing in the USC area over the last decade, the vast majority of mortgage applications in every year have been for single family properties.
- Since 2010, denials of single family mortgage applications have been decreasing in both the USC Area neighborhood as well as the larger City of Los Angeles. However, in nine out of the last 10 years, a larger share of single family applications have been denied in the USC Area compared to the Citywide average.
- Mortgage applications for single family properties have been largely concentrated in the southern and western portions of the neighborhood around USC. Census Tract 2316 (the southwestern corner of the neighborhood) has experienced the most single family mortgage applications since 2010.
VARIABLE DEFINITION
Mortgage Applications by Property Type: The number of mortgage loan applications to financial institutions for both single family and multi-family properties (first visualization)
Single Family Mortgage Application Denials: The percent of single-family mortgage applications that were not approved by the financial institution (second visualization)
Single Family Mortgage Applications: The number of mortgage loan applications to financial institutions for single family properties
DATA SOURCE
Home Mortgage Disclosure Act (HMDA), Consumer Financial Protection Bureau
DATA NOTES
More About Mortgage Applications for Single Family Properties: Single family mortgages are loans that an individual or family borrows from a financial institution in order to pay for a home. An individual needs to make regular payments to pay-off the principal cost or the loan, and then they also need to pay for the interest of the loan that accumulates over time. Mortgage application acceptance, denials, and the quality of mortgages are an important arena of American racial inequality that determines residential access and social opportunity.
Mortgage Application/Denial Demographics
Key Takeaways
- Between 2010 and 2020, the average income of mortgage applicants in the USC Area neighborhood increased significantly. The share of applicants with incomes under $69,000 decreased from 42% in 2010 to just 4% in 2020. By contrast, the share of applicants with incomes above $194,000 increased from 10% in 2010 to 53% in 2020.
- Mortgage applicants in the lowest income group (under $69,000) were equally as likely to receive application denials in the USC Area and the City as a whole, with a 20% denial rate. However, applicants in the middle three income groups (those making $69,000 – 194,000) were more likely to have their applications denied in the USC area than the City as a whole.
- Between 2010 and 2020, mortgage applications from Latino/a heads of household decreased significantly from 61% in 2010 to 36% in 2020. By contrast, the share of applications from White and Asian heads of household increased over the same period. Black heads of household made up fewer than 10% of mortgage applicants in every year.
- Mortgage applications from Black heads of household were denied at higher rates than any other racial/ethnic group, and applications from Black households were denied at higher rates in the USC area than the City average.
