Los Angeles Poverty Dashboard
Created for the City of Los Angeles Ending Poverty Summit
About the 2022 Ending Poverty Summit
On October 13, 2022, the Los Angeles Community Investment for Families Department (CIFD) partnered with Citi Community Development to host the 2022 Ending Poverty Summit at the Los Angeles California Endowment. The Summit expanded upon the first-ever Poverty Summit in 2019, which spurred the initiation of a citywide goal to end child and family poverty by 2035.
The 2022 City of Los Angeles Ending Poverty Summit was held to re-engage stakeholders, solidify commitments and create an action plan to end poverty in Los Angeles by 2035.
About the Los Angeles Poverty Dashboard
The Poverty Dashboard was created by Neighborhood Data for Social Change to accompany the City of Los Angeles Ending Poverty Summit. The data is intended to summarize key components of the landscape of poverty in the City of Los Angeles. Metrics are disaggregated at various demographic levels and shown for relevant political geographies. Through understanding the composition of poverty, political action can best address the goal of ending family and child poverty in Los Angeles by 2035.
Poverty Summit Report
Click the link below to download the full report for the Los Angeles 2022 Ending Poverty Summit.
Income Across Los Angeles City Council Districts
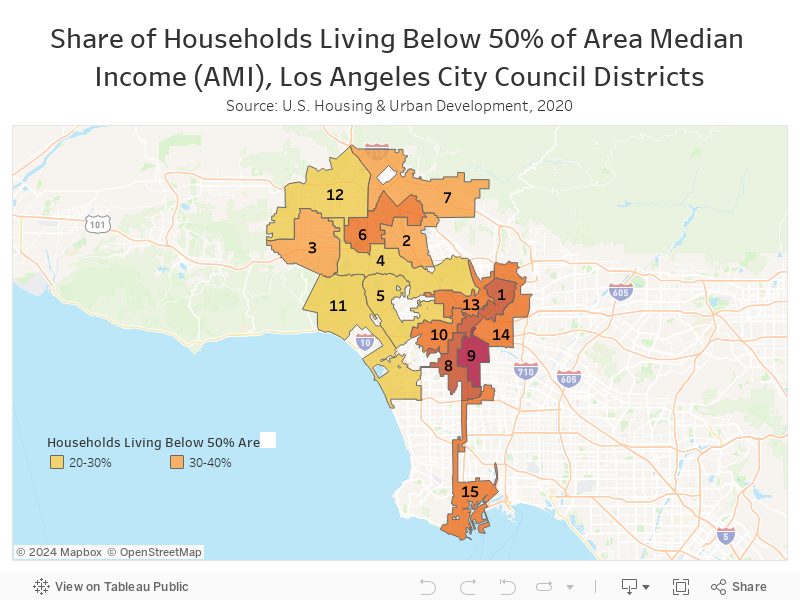
Area median income is a place-based measure of need used by the U.S. Department of Housing and Urban Development (HUD) to determine eligibility for affordable housing placements. HUD measures a household’s income against the Area Median Income ($98,200 for a family of four in the Los Angeles County in 2023).
Households making less than 80% of the Area Median Income (AMI) are considered “Low Income,” those making less than 50% of AMI are considered “Very Low Income,” and those making less than 30% of AMI are considered “Extremely Low Income.” Generally, Low Income (80% AMI) households are eligible for various affordable housing programs like federal housing choice vouchers, but many programs prioritize placements for Very or Extremely Low Income households.
- Households with lower incomes are concentrated in the Southeast part of the city.
- In Council Districts 1, 8 and 9, more than half of households make less than 50% of the Area Median Income.
- In Council District 9, nearly 40% of households make less than 30% of the Area Median Income.
The Demographics of Poverty
This visualization shows the share of people living in poverty across various demographic groups and geographies. Data comes from the 2022 American Community Survey 5-year estimates.
Helpful tips for navigation:
- Choose a demographic group from the dropdown menu titled “Demographic Category” on the left.
- Add or remove geographies (including City Council Districts) from the dropdown menu titled “Geography” on the right. For ease of viewing, we recommend comparing a maximum of four geographies at one time.
- Hover over a circle to read an interpretation of the data, or open the “Key Takeaways About the Data” accordion below the visualization.
Terminology Key: AIAN (American Indian Alaska Native), NHOPI (Native Hawaiian or Other Pacific Islander)
Methodology Note: People who identify their ethnicity as Hispanic or Latino/a may also identify as any of the other racial categories shown. White is the only racial category that is separated by Latino/a or Hispanic ethnicity.
First developed in 1963, the Federal Poverty Level (FPL) measures what it would have cost to afford a subsistence diet – one that just keeps you from starvation and/or severe malnutrition – in addition to clothing, shelter and utilities. FPL is a commonly used measure, but should be used with caution when trying to understand the full picture of poverty and need in a given place.
In addition to the fact that individuals and families deserve to have resources that protect them from more than just severe malnutrition, FPL also fails to take into account the changing needs and budgets of families over the past 50 years, such as child care and medical expenses. The threshold is updated annually to reflect the cost of inflation to food, but does not account for relative increases in other consumer goods. As a result, the marginal increases in FPL each year likely do not adequately reflect the actual changes in purchasing power required for many essential goods. For these reasons, the numbers in this visualization almost certainly underestimate the true scope of need among the groups shown.
For additional information on metrics measuring poverty, see the full 2022 Ending Poverty Summit Report linked in the section below.
Age
- Children under 18 are disproportionately in poverty compared to other age groups.
- As of 2022, 22% of children in the City of Los Angeles are living below 100% of the Federal Poverty Threshold (FPT) compared to 16% of children across the State of California.
Education
- Levels of Education are highly correlated with poverty rates.
- As of 2022, 25% of people who do not have a high school diploma in the City of Los Angeles are living below 100% FPT compared to 20% of people across the State of California.
Employment
- Employment is highly correlated with poverty rates.
- As of 2022, 29% of people who are unemployed in the City of Los Angeles are living below 100% FPT compared to 24% across the State of California.
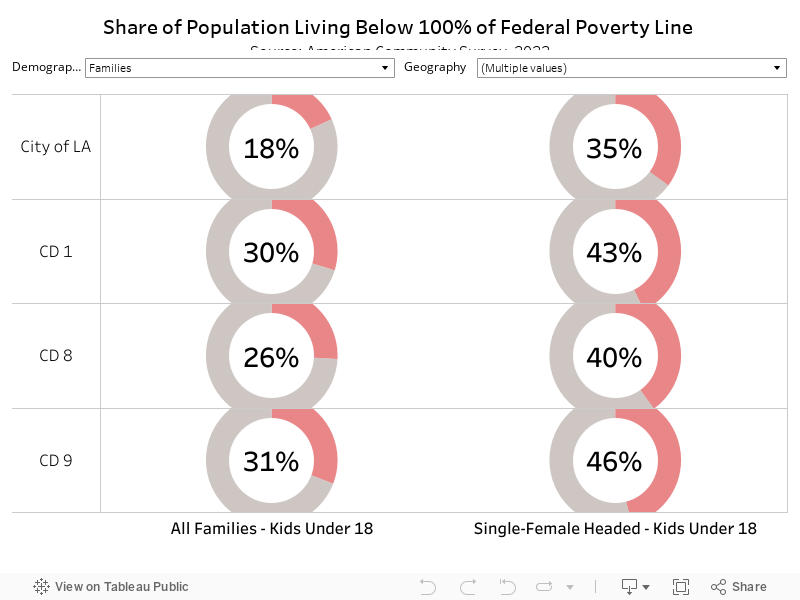
Families
- Single female-headed households with children experience particularly high poverty rates.
- As of 2022, 35% of single-female headed households with children under 18 are living below 100% FPT in the City of Los Angeles compared to 29% of such households across the State of California.
General Population
- A larger share of people are living in poverty in the City of Los Angeles compared to both California and the United States.
- As of 2022, 17% of residents in the City of Los Angeles are living below 100% FPT compared to 12% across the State of California.
Race/Ethnicity
- Across the City of Los Angeles, State of California and U.S. at large, people who identify as Asian or non-Hispanic white live in poverty at lower rates than other racial/ethnic groups. Conversely, people who identify as Black, Indigenous or Latino/a tend to live in poverty at higher rates.
- This concentration is due to many decades of racist policies that aided wealth-building for white families at the expense of Black, Indigenous and other families of color. To learn more, see the full 2022 Ending Poverty Summit Report linked in the section below.
Sex
- People identifying as female tend to experience higher poverty rates than those identifying as male.
- As of 2022, 18% of people who identify as female in the City of Los Angeles are living below 100% FPT compared to 13% of people who identify as female across the State of California.
Contributors: Elly Schoen, Cameron Yap, Matthew Vaughn, Gabriela Magaña, Debarun Sarbabidya
For questions, please contact Cameron Yap at cyap@usc.edu.
