Los Angeles COVID-19 Dashboard
October 2023 Update
Neighborhood Data for Social Change (NDSC) launched the Los Angeles COVID-19 Dashboard during the early stages of the pandemic in 2020 to help translate data released by the Department of Public Health. The dashboard, updated first on a weekly and then on a bi-weekly basis, provided residents and organizations throughout Los Angeles with easily digestible trends related to causes, deaths and vaccinations across neighborhoods and demographic groups.
In May of 2023, the World Health Organization (WHO) and the U.S. Department of Health and Human Services (HHS) declared an official end to the pandemic. The NDSC team has elected to pivot the dashboard from a place for regular updates to a historical record of trends during the pandemic. The data now shows cumulative rates of cases and deaths over the course of the pandemic as well as vaccination rates as of October 2023. We hope this will continue to be a resource for Los Angeles County communities as we continue to grapple with the wide reaching impacts of the COVID-19 pandemic.
As a part of this project, our team has acquired and cleaned a large record of data related to COVID-19 at the neighborhood level in Los Angeles County from April 2020 – October 2023. If you are interested in using this data, please contact Cameron Yap at cyap@usc.edu.
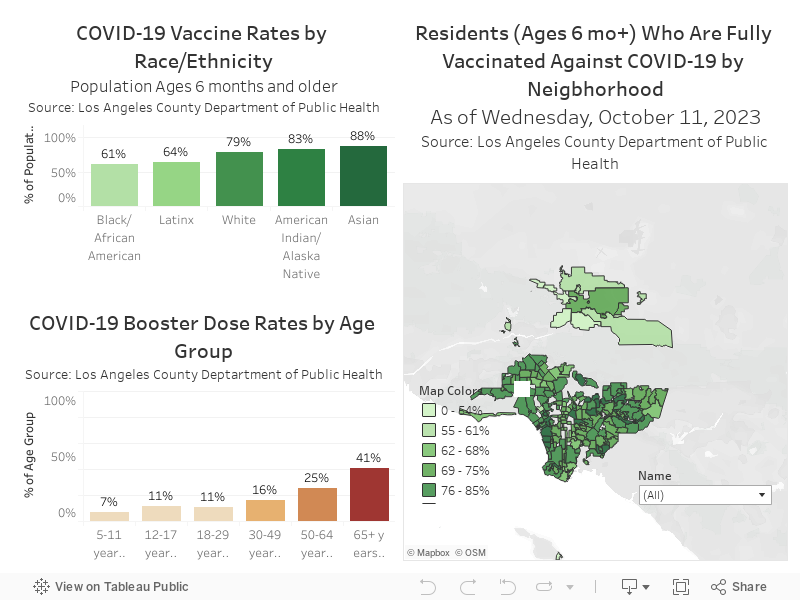
COVID-19 Vaccinations
Vaccines made by Pfizer, Moderna and Johnson & Johnson are now available to any Los Angeles County resident ages 6 months and up. The map below shows the percent of people ages 6 months and older who are considered fully vaccinated (have received at least two doses of a vaccination) across LA County neighborhoods. The top chart shows the percent of people ages 6 months and older who have received a vaccine dose for various racial and ethnic groups. The bottom chart shows vaccination rates for various age groups in the County.
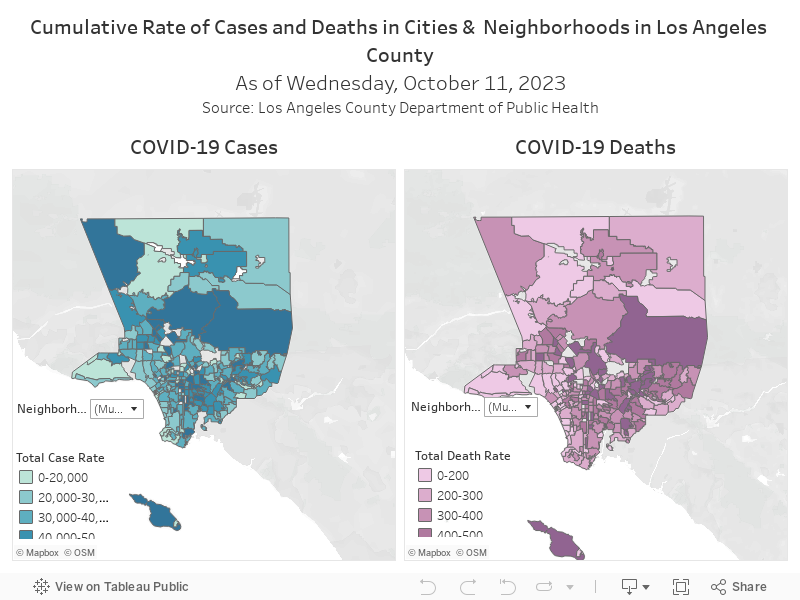
Cases and Deaths by Neighborhood
In order to help our community understand where cases of COVID-19 exist and where the most vulnerable populations live, we’ve mapped the seven day growth in both cases and deaths for Los Angeles County neighborhoods. The data is updated biweekly.
Hover over a neighborhood below to see various metrics related to COVID-19 cases and deaths as well as neighborhood characteristics including the size of the 65+ population, people without health insurance, the population living below the federal poverty line, and pre-COVID rates of asthma-related ER visits per 1,000 people.
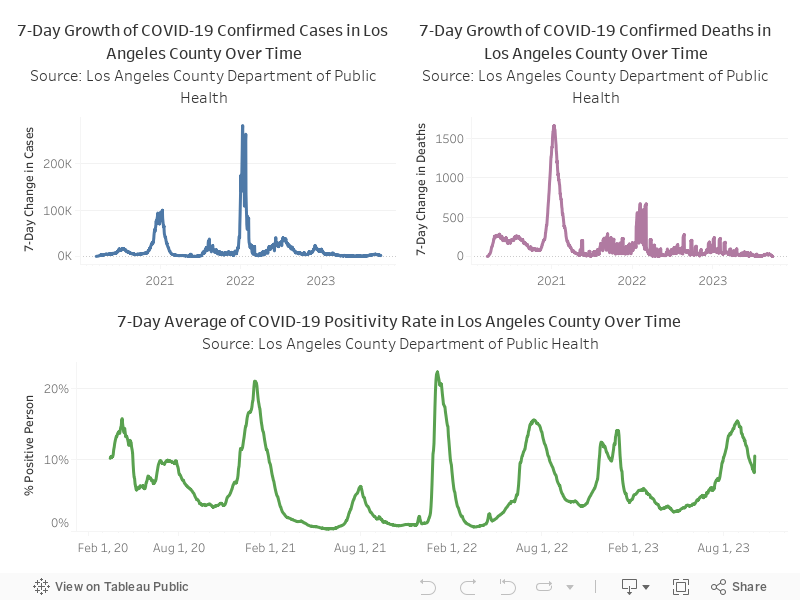
Countywide Cases & Deaths
Hover over the line graphs below to see the 7-day change in reported cases and deaths across the county. The green graph displays the 7-day average positivity rate of persons tested in Los Angeles County.
Further down the page, explore cases and deaths by various racial and ethnic groups. All data on COVID-19 is pulled directly from the LA County Department of Public Health COVID-19 Surveillance Dashboard and updated bi-weekly.
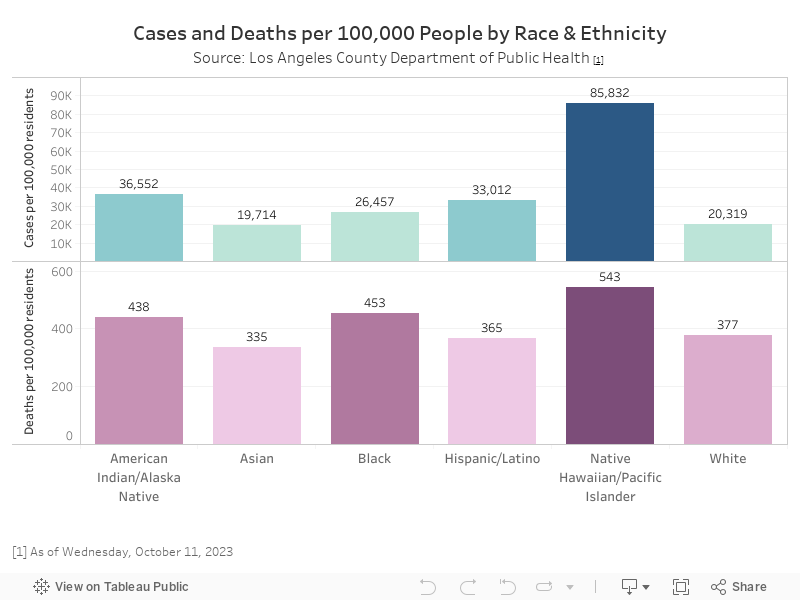
*Cases by Race/Ethnicity exclude Long Beach and Pasadena.
Why are These Variables Important
to Measure?
Each of the variables shown on the map above are important metrics to consider when exploring the impact COVID-19 is having on our community. The rate of cases per 100,000 people allows you to compare cases across neighborhoods and cities with differing population sizes. The one day case increase variable helps community members understand how quickly the virus is spreading.
Older adults (defined here as 65 and over) are at more risk of contracting serious cases of COVID-19 that may require hospitalization. Understanding where older adults live throughout the county will help shed light on one of the most vulnerable populations. Because COVID-19 often spreads in the lungs, people with pre-existing conditions like asthma are also at a greater risk of developing serious cases requiring hospitalization. Data on asthma-related ER visits per 1,000 people from 2017 are shown for each neighborhood to help contextualize which communities have had higher rates of serious asthma issues in the past.
Other highly vulnerable populations are those living without health insurance and those living with incomes below the federal poverty line, due to the high cost of potential hospitalization. According to initial reports, the cost of receiving treatment for serious cases of coronavirus that require hospitalization may reach $34,000 for those without insurance.
For more information on your neighborhood, please visit the main NDSC mapping portal.

Data Notes
– The number of total cases includes deaths, represents the confirmed number of cases based on available testing, and includes cases reported by Long Beach and Pasadena Public Health Departments. Data reported in LA County DPH press releases are reported as of 8 PM from the previous dat and represent the “report date” rather than the “episode date.”
– Data on testing comes from Electronic Lab Reporting (ELR) data only and is updated as more information becomes available each week. Not all laboratories submit electronic reports.
– Data on age distribution, total population, uninsured rates, and population living below the federal poverty line come from 2018 American Community Survey 5-year estimates. Data on asthma-related ER visits come from the CalEnviroScreen 3.0.
Geography Notes
– The county wide (Map 1) includes the approximately 250 neighborhoods in Los Angeles County as defined by the Los Angeles Times Mapping LA project.
– Neighborhood boundaries provided by the LA County Department of Public Health were modified to fit NDSC city and/or neighborhood boundaries. As a result, the numbers in these maps may differ slightly from the counts shown by the Department of Public Health.

Contributors: Elly Schoen, Molly Creighton, Mackenzie Goldberg, Peter Griffin, Grace Persico, Kelsey Taekens, Claire Zhang
