Home Affordability in the USC Area
In 2006, when USC began planning its new mixed-use “Village” development, the UNIDAD Coalition ––a group of community-based organizations in South Central–– arose to ensure that it contained concrete benefits for the long-term residents in the surrounding community. With their organizing, UNIDAD negotiated a community benefits agreement that included a $20 million investment from USC towards an affordable housing development fund, of which USC has currently contributed $10 million to. As a fulfillment of part of the community benefits agreement, Neighborhood Data for Social Change has created the USC Area Housing Dashboard to track the demographic, residential stability, and built environment-relevant data surrounding the community. This data story takes a deeper dive into some of the trends shown on the dashboard by examining single-family mortgage applications in the USC area in the last decade following the Great Recession.
The Racial Wealth Gap & Gentrification
Over the last century in America, widespread homeownership has been a key component of the narrative about an “American Dream,” and of a society with opportunities for social mobility. Despite its many financial benefits, all Americans have not had equal access to homeownership. America is a nation marked by racial injustice and inequality, and this inequality is deeply implicated within, and cannot be separated from, housing. In 2016, the Federal Reserve noted that the average White family has 8x the wealth of the average Black family, and then 5x the wealth of the average Latina/o family. A separate analysis found that rates of homeownership in the Black community today – in the second decade of the 21st century – are as low as they were in the 1960s.

Racist housing policies like redlining enacted by the Federal Housing Authority during the 20th Century and predatory lending practices against Black and Latina/o households by large financial institutions in the years leading up to the Great Recession have led to this systemic wealth gap along racial and ethnic lines. In recent years, many historically Black and Latina/o neighborhoods in cities across the U.S. have experienced large increases in property values due to an influx of wealthy and oftentimes white residents, a phenomenon known as gentrification. A recent study found that between 2000 and 2013, over 110,000 Black residents and nearly 25,000 Latino/a residents were displaced from U.S. metro areas due to gentrification.
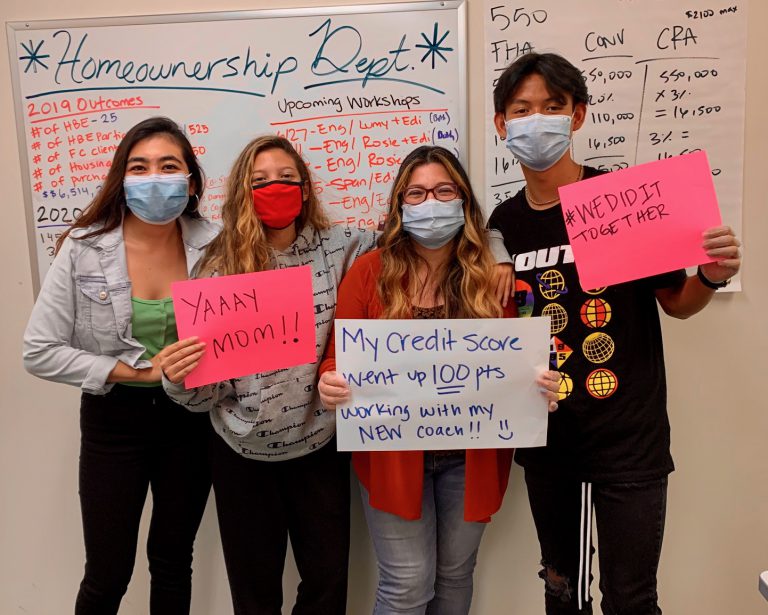
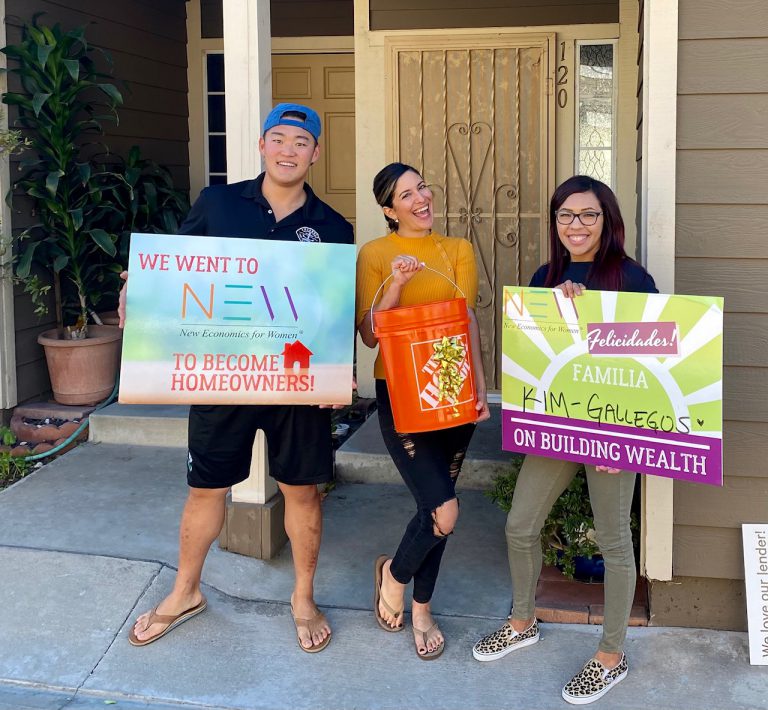
Given all of these compounding and systemic barriers that exist for people of color to build wealth and thrive in their own communities, NEW Economics for Women is an organization that seeks to create economic mobility for communities of color through wealth creation, housing, education, entrepreneurship, and civic engagement. This data story examines homebuying trends over the last decade in the historically Black and Latina/o community surrounding the University of Southern California (USC) and how NEW Economics for Women is promoting wealth building and homeownership for longtime residents.
Housing Justice in the USC Area
In this story, the “USC Area” refers to Exposition Park and Historic South Central, the neighborhoods surrounding USC on its West and East sides respectively. This USC Area is home to a predominantly Latina/o and Black community – in 2019, 61% of residents identified as Latina/o, 13% identified as Black, 11% as Asian, and 11% as White. The area has experienced systemic oppression and a lack of investment over multiple decades, but it is also home to community-based organizations and movements advocating for progressive policy changes in the City of Los Angeles. Like many other historically Black neighborhoods in Los Angeles and other metro areas, the Black population in the USC area has been displaced over the last several decades. As shown in the visualization below, in 1990, the neighborhood was home to over 20,200 Black residents (24% of the population) – by 2019, there were just under 11,500 Black residents in the area making up 13% of the population (American Community Survey, U.S. Decennial Census). Over that time period, the physical characteristics of the neighborhood also changed as USC expanded its campus and built new developments such as the Galen Center and the Gateway Towers.
Like many other gentrifying metropolitan areas across the U.S., the USC area has experienced a substantial increase in home property values over the last decade. According to analysis conducted using Zillow Home Value Index data, the typical home value in the two zip codes making up the USC area more than doubled from just under $284,000 in 2010 to over $656,000 by 2020. As shown in the figure below, the larger City and County of Los Angeles have also experienced large increases in typical home value.
However, the USC area differs in important ways from the larger City and County that make the exponential growth in home values difficult to navigate for longtime residents of the neighborhood. For example, the share of residents who are homeowners in the USC area has consistently hovered around 15% over the last decade – less than half of the City of Los Angeles average (American Community Survey). This means that a small share of neighborhood residents would have been generating wealth from the large increases in neighborhood home values. Additionally, in 2019, 72% of USC area residents over the age of 25 were making under $60,000 in income, meaning that buying a home at the quickly rising prices is likely financial unfeasible for the vast majority of neighborhood residents (American Community Survey).
Furthermore, as shown in the chart below, the share of USC area residents making under $30,000 fell by 10% points over the last decade while the share of residents making over $100,000 has doubled – suggesting that residents with low incomes have been displaced by wealthier residents (American Community Survey).
The Changing Demographics of Homebuyers
Just as there have been significant changes in the home values and incomes of USC area residents, there have also been substantial changes in the demographics of people who are applying to purchase single-family homes in the neighborhood. In 2010, people who identify as Latino/a made up 62% of the neighborhood’s population and 60% of the neighborhood’s mortgage applicants. A decade later, Latino/as still make up roughly 60% of the resident population, but they account for just 37% of mortgage applicants. People who identify as white or Asian have made up an increasingly large share of mortgage applicants since 2010. In 2019, they made up 22% of the neighborhood’s residents and 58% of mortgage applicants (Home Mortgage Disclosure Act, American Community Survey).
In addition to the fact that Black and Latina/o are making up a smaller share of mortgage applicants in the USC area, when such households have applied for mortgages, they have gotten denied by financial institutions at higher rates than White and Asian Households. Across both the City and the USC area, Black and Latina/o households have experienced higher rates of mortgage application denials than other racial/ethnic groups since 2010. Furthermore, applications from Black households were denied at much higher rates in the USC Area than the Citywide average (Home Mortgage Disclosure Act). While racial discrimination from financial institutions is very likely a factor in the discrepancy in denial rates (read more about racial discrimination in small business lending in this October 2020 data story), there are likely other institutional barriers at play.

Financial Literacy & Affordability Barriers
As shown in the chart below, households in the middle-income range of mortgage applicants (those with incomes between $69,000 and $128,000) were denied at significantly higher rates in the USC area compared to the City average (Home Mortgage Disclosure Act). According to NEW Economics, who works with first time homebuyers to navigate the mortgage application process, households in these middle-income ranges simply would not be able to afford the skyrocketing home prices in the USC neighborhood.
Over the last year, NEW Economics worked with clients with incomes ranging between $62,000 and $80,000 (falling into the lowest two income groups on the chart above) across the City of Los Angeles. NEW’s clients are, on average, already in a significant amount of debt due to student loans and the use of credit cards to supplement income for basic needs. In order to afford a home in the USC area at current prices, NEW’s clients would be paying between 62% – 79% of their monthly incomes towards a mortgage and debt payments. According to NEW, financial institutions typically allow a “debt to income” ratio between 43% – 50%, which may explain in part why applicants in these middle-income categories have been denied at higher rates in neighborhoods like the USC area that are becoming increasingly unaffordable.
In addition to affordability issues, however, NEW notes there are also systemic knowledge gaps for middle and lower income first time homebuyers. Often, such borrowers contact a real estate agent or loan officer to seek financing before they properly understand their financial profile. In a financial industry that has been historically predatory against lower income households and people of color, such households are left at best, with a mortgage denial, or at worst, a financially unsustainable amount of debt.
Looking Forward
NEW’s Homebuyer Education program has been providing homeownership education and guidance for nearly 20 years. In that time, the program has evolved with the ever-changing real estate market to keep participants competitive and well prepared to step into homeownership. Households who participate in NEW’s Homebuyer Education program before meeting with an agent or loan officer are 95% less likely to get denied for a mortgage loan. In order to reduce denial rates, loan and real estate professionals should encourage first time homeowners to go through a homebuyer education program prior to seeking financing for a home.


However, financial literacy is a small piece of the complex housing affordability crisis in neighborhoods like the area surrounding USC. Homebuyer education programs alone can’t stop the widespread displacement of Black and Latino/a residents who have called South Central home for decades. “Our team at NEW must be very honest (sometimes painfully honest) with our participants,” says Rosie Papazian, NEW’s Program Manager. “The sad truth is that many of them will not be able to afford it here, but if the goal is to build wealth – let’s see where you can make it happen, and build from there.”
For more information about housing conditions in the USC area, visit the USC Area Housing Dashboard.
Elly Schoen

Joshua Cantong
Joshua Cantong (he/them) is a second-year Master of Public Policy (MPP) candidate at Price, with a concentration in Urban Spatial Analysis. As a Graduate Research Assistant at the USC Sol Price Center for Social Innovation, Josh works specifically within the Neighborhood Data for Social Change (NDSC) initiative.
Sources
Bhutta, N., Chang, A. C., Dettling, L., Hsu, J. H., Hewitt, J. (2020). Disparities in Wealth by Race and Ethnicity in the 2019 Survey of Consumer Finances. Board of Governors of the Federal Reserve. Link
Cohrs, R. (2018). USC promised millions in community benefits with the Village. Did it deliver?. Link
Famighetti, C., Hamilton, D. (2019). The Great Recession, Education, Race, and Homeownership. Economic Policy Institute. Link
Hondagneu-Sotelo, P., Pastor, M. (2021). South Central Dreams: Finding Home and Building Community in South L.A. NYU Press. Link
Richardson, J., Mitchell, B., Franco, J. (2019). Shifting Neighborhoods: Gentrification and cultural displacement in American cities. National Community Reinvestment Coalition. Link
Urban Institute. (n.d.) Reducing the Racial Homeownership Gap. Link
Photo Attributions
Cover Photo: Photo courtesy of Istock/choness
Photo 1: Photo courtesy of Istock/fizkes
Photo 2: Photo courtesy of Istock/LPETTET
Photos 3- 5: Photos courtesy of NEW Economics for Women

