Transportation Access in the East San Gabriel Valley
Access to cost effective, time efficient and environmentally conscious transportation is a pressing issue affecting people around the world. In 2017, INRIX Global Traffic Scorecard reported that traffic congestion has been increasing year over year around the globe. INRIX also found that the Los Angeles metro area had the worst traffic congestion in the world for the sixth year in a row, with drivers spending an average of 102 hours in traffic over the course of the year. Los Angeles’ traffic congestion is environmentally harmful and poses significant threats to the quality of life for Angelenos. The severity of traffic congestion in Los Angeles makes residents susceptible to poor air quality and reduced access to employment outside of the area surrounding their neighborhoods.
Over the past decade, L.A. County voters have passed a number of historic tax increases to expand the public transit system, including Measure R in 2008 and Measure M in 2016 that expanded both bus and rail lines around the County. Despite these recent investments to expand public transit and improve traffic conditions, public transit ridership in Los Angeles County has declined over the past five years, with just 7% of riders using public transit to get to work according to 2016 5-year American Community Survey estimates.
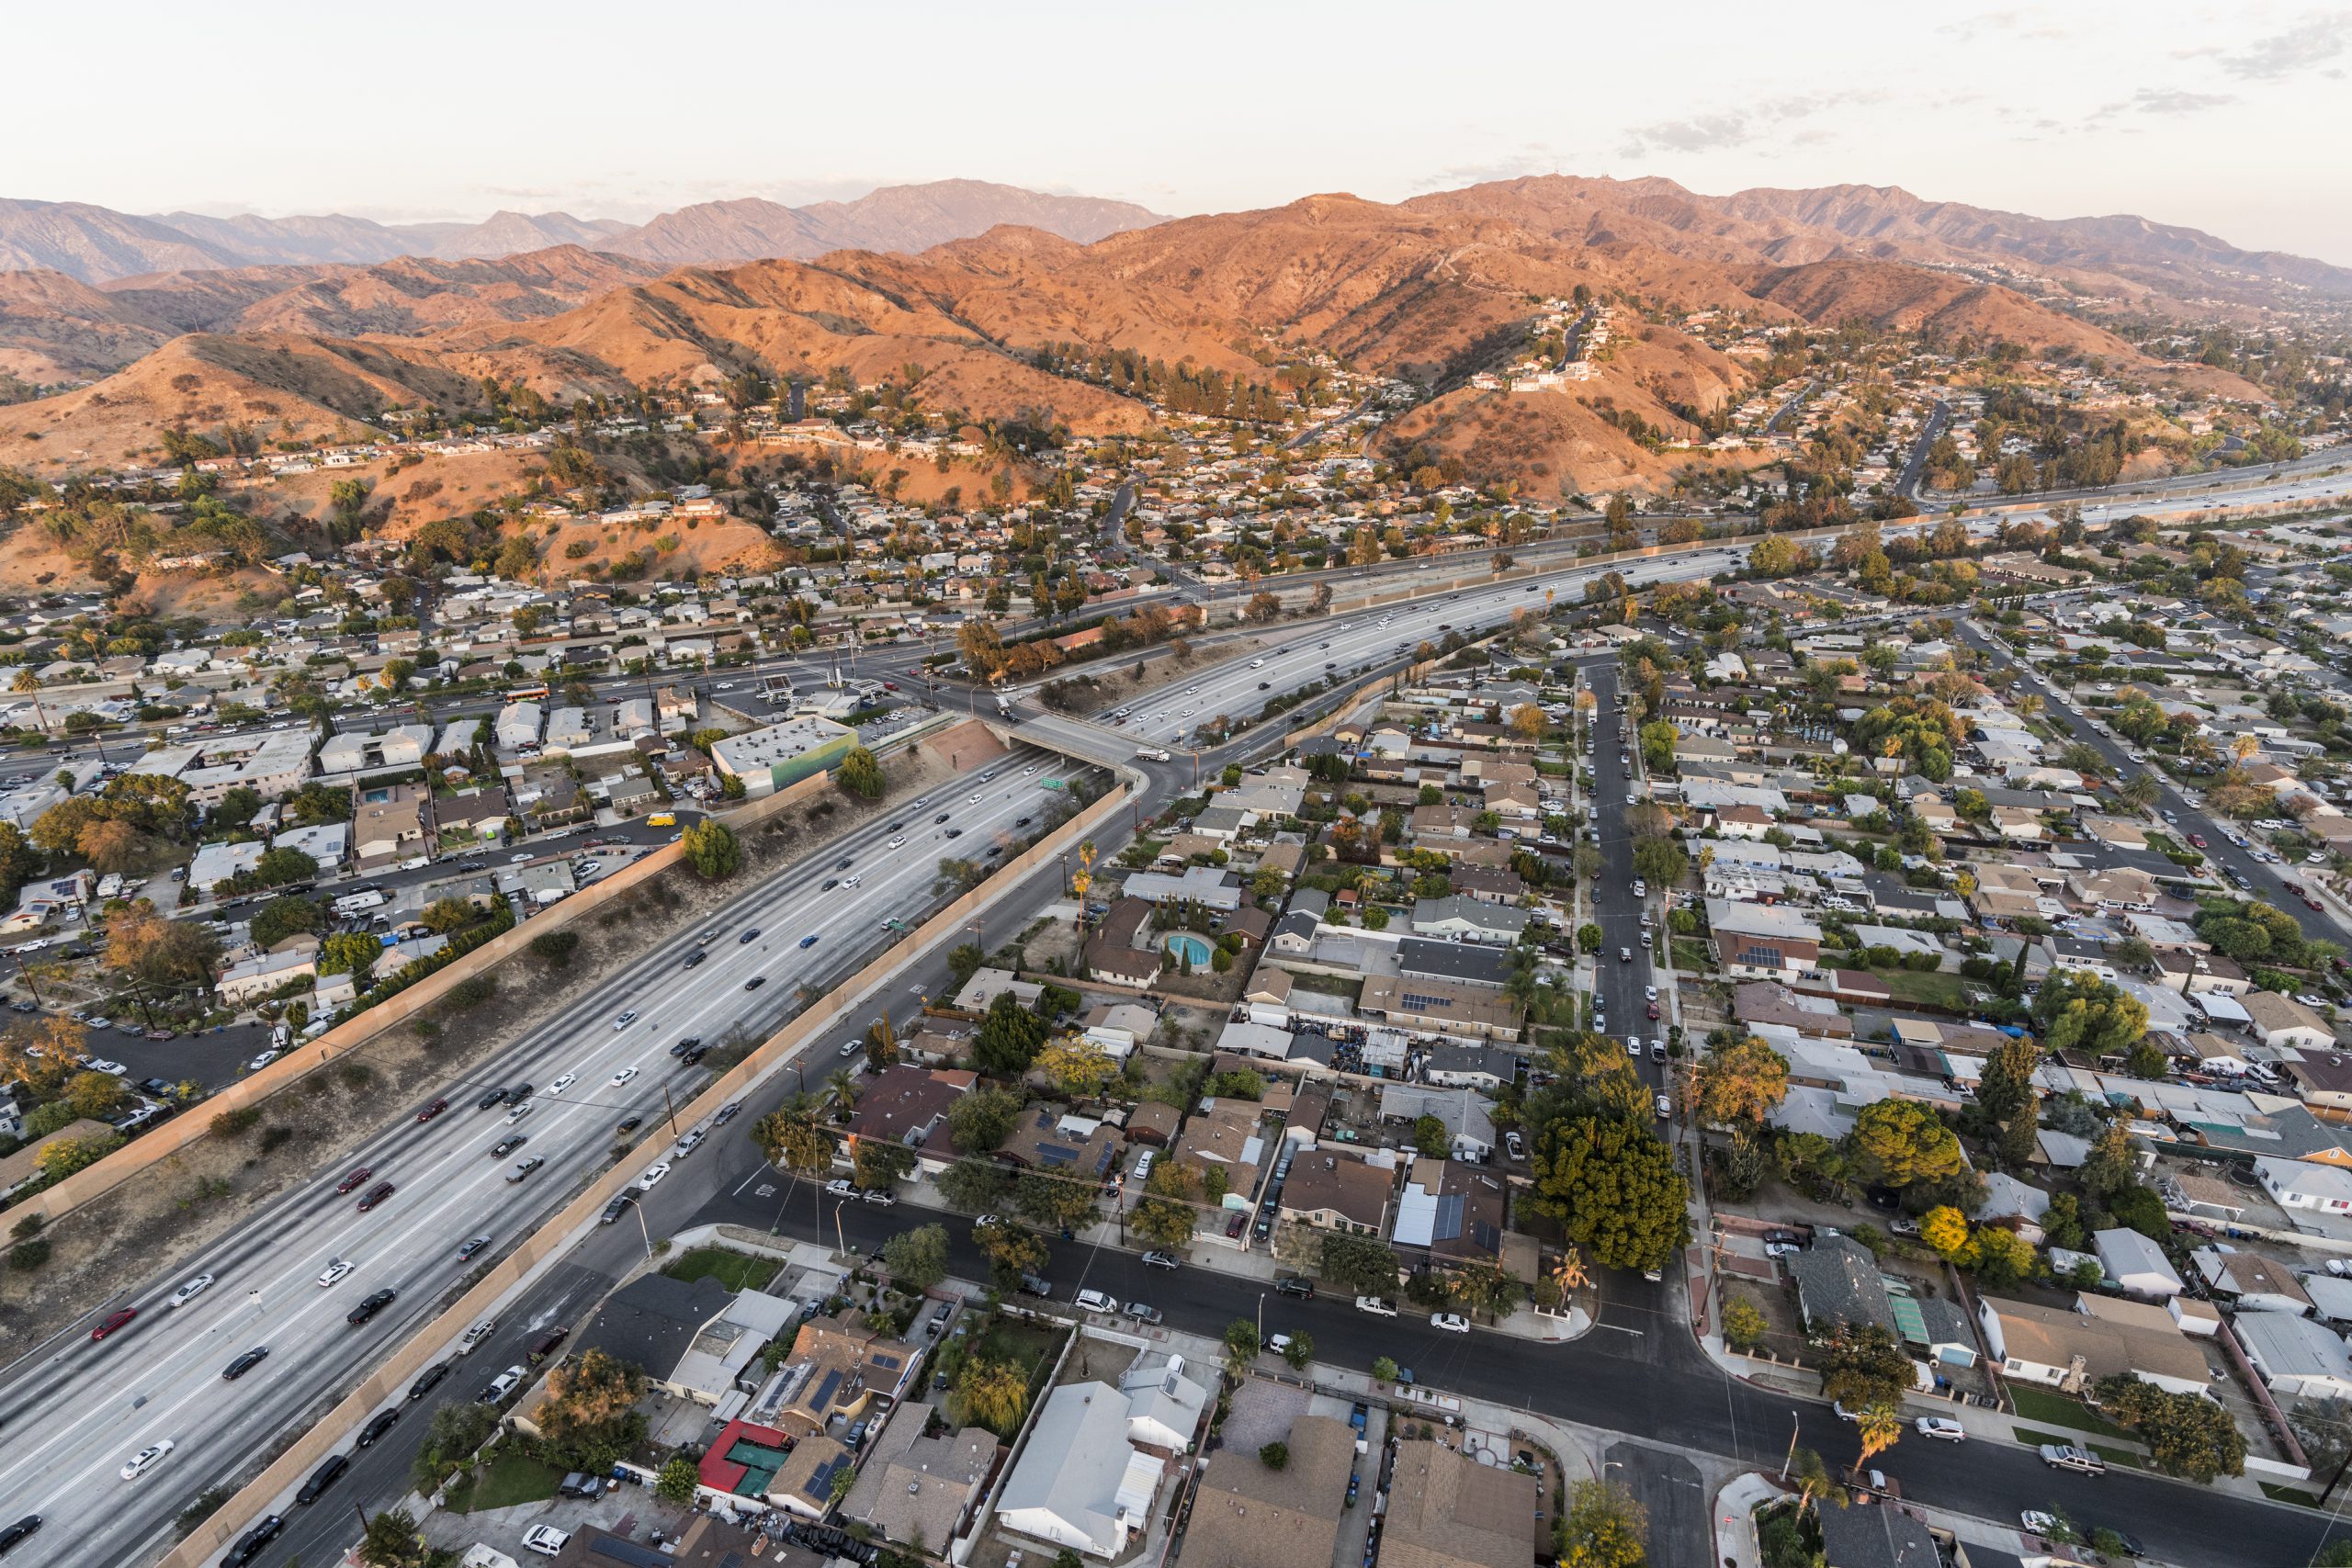
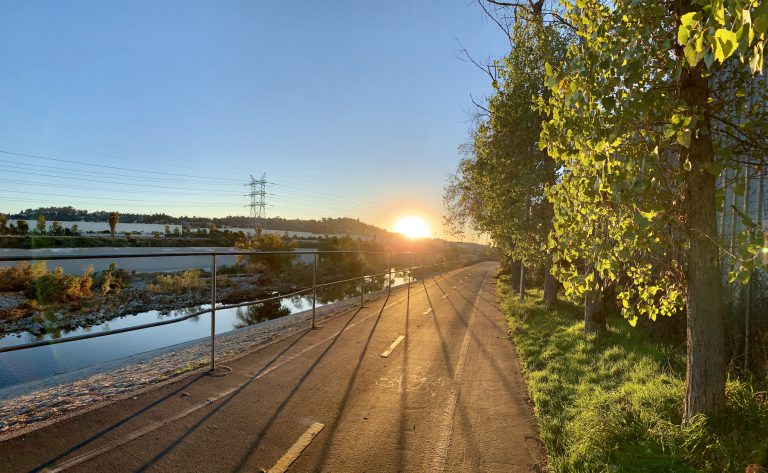
The recent expansions have done little to improve traffic flow in the East San Gabriel Valley where public transit use is just 3% – less than half of the county average. The East San Gabriel Valley is located directly to the east of Downtown Los Angeles on the eastern edge of the County. Traffic in the area is especially congested as morning and evening commuters from three separate counties, including Los Angeles, Riverside and San Bernardino, travel through the region daily to get in and out of the Los Angeles. East San Gabriel Valley’s limited public transit system, coupled with excessive traffic congestion in the area, make residents particularly vulnerable to the consequences of inadequate transportation options.
The East San Gabriel Valley
The East San Gabriel Valley includes the twenty-four NDSC neighborhoods shown on the map below. The East San Gabriel Valley is home to 918,250 of Los Angeles County residents; about 10% of Los Angeles County’s total population according to the 2016 5-year American Community Survey. Commuters in the East San Gabriel Valley rely primarily on the interstate and state highways, with 77% of commuters in the area driving alone to work. The San Gabriel Valley is serviced by the Metrolink Commuter Rail as well as regional and local bus lines. With the passage of Los Angeles County Measure M, the San Gabriel Valley Subregion Plan aimed to improve high traffic lanes and support commute travel by expanding rail transit and enhancing bus routes. Still, traffic in the East San Gabriel Valley is getting worse as morning and evening commuters travel through the Valley on the five major interstate and state highways passing through the area. According to the CalEnviroScreen 3.0 report, East San Gabriel Valley census tracts that have interstates running through them have some of the highest traffic density in the state.
Hover over a neighborhood on the map below to see its median household income, PM2.5 concentration, and public transit usage.
Environmental & Health Impacts
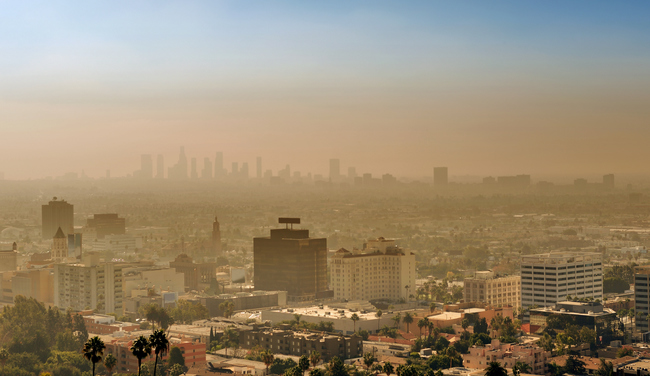
According to the CalEnviroScreen, excessive traffic is associated with more noise pollution and higher vehicle-related injuries in neighborhoods as interstate motorists often cut through residential streets to avoid interstate traffic. Traffic is also one of the main sources of air pollution, and areas with high traffic density tend to have lower air quality. One way to measure air quality is the concentration of fine particulate matter (PM2.5) in the air. PM2.5 refers to tiny particles in the air that are 2.5 micrometers or less in diameter, allowing them to penetrate the lungs. Because PM2.5 can penetrate the lungs and bloodstream, it can cause many adverse health effects including lung and heart disease. A study published in the Journal of the American Medical Association estimated that for every 10 micrograms per cubic meter (μg/m3) increase in fine particulate air pollution, there is an associated 4%, 6% and 8% increased risk of all-cause, cardiopulmonary and lung cancer mortality, respectively. The average PM2.5 concentration in the East San Gabriel Valley is 11.58 μg/m3 – ranking it in the worst 65% in the State. The East San Gabriel Valley’s average PM2.5 concentration is just below the EPA standard of 12 μg/m3 as the threshold for healthy air, demonstrating the importance of taking action to improve environmental conditions in the area.

Planning in Unincorporated Areas
While the environmental and health effects of traffic density impact all residents of Los Angeles County, responses to the problem can differ across communities based on their local governance structure. For example, the City of Los Angeles has a department dedicated to transportation in the city and recently released the Mobility Plan 2035 to improve transportation systems for Los Angeles City residents in addition to the work already being done by the County through Measure M. The unincorporated areas throughout the County are represented through their County Supervisorial Districts with dedicated field office staff focused on transportation. In 2015, the County developed a General Plan that provides a framework of growth over the next 20 years for the unincorporated communities throughout the County. One of the primary challenges in servicing unincorporated communities is the fragmentation of the communities as compared to single municipalities, which can present challenges in getting public input about new ideas and projects.
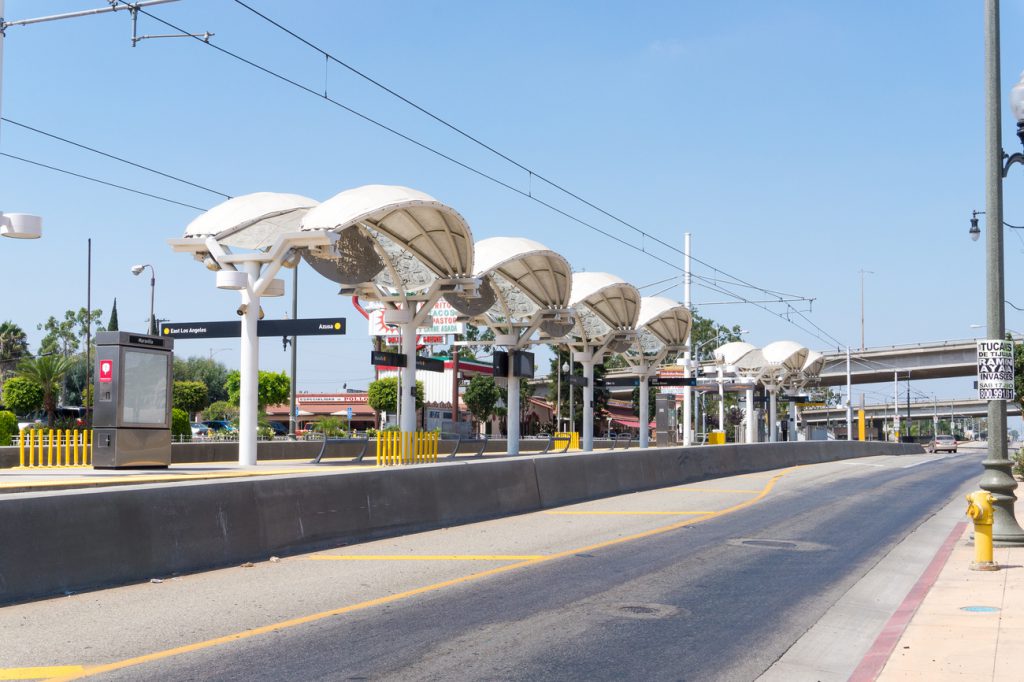
There are 21 unincorporated communities that make up 25% of the East San Gabriel Valley region and fall into County Supervisorial Districts 1, 4 and 5. In order to address policy issues in these unincorporated areas, such as increasing traffic congestion, shortage of developable land, and environmental concerns, the County Department of Regional Planning has set forth an East San Gabriel Valley Area Plan (at the recommendation of the 2015 General Plan) meant to address planning and land use issues in these areas.
Opportunity Area: Avocado Heights
The 2015 General Plan identified the unincorporated community of Avocado Heights as an area of opportunity for further study in its land use. According to the Department of Regional Planning, the area is made up of primarily single-family residences and also contains a large industrial presence. Avocado Heights has a population of around 10,000 people, with a Hispanic population of 84% as of the latest American Community Survey 5-year estimates. The effects of inaccessible transportation are particularly pronounced in the neighborhood: less than 1% of the population uses public transit and the PM2.5 concentration in the neighborhood is 12.05 μg/m3 – ranking in the worst 80th percent in the state and below the threshold for healthy air.
Through the East San Gabriel Valley Area Plan, the County will further study how Avocado Heights is using its land and make potential recommendations for changes that will improve the quality of life for residents. Such recommendations could include transforming some industrial land into commercial use and improving local transportation infrastructure to help mitigate the effects of high traffic density and pollution burden in the area. The plan is in its early stages, and you can check for more updates about the results of initial analysis and planned changes here.
Los Angeles County faces some of the toughest challenges around traffic and transportation in the world. In addition to having the worst traffic congestion of any metro area, there are many communities throughout the County like Avocado Heights that don’t meet EPA standards for safe air quality. The East San Gabriel Area plan, one of many area plans adopted through the 2015 General Plan, provides an example of how the County is working to address these challenges through smart land use and transportation planning. However, creating a smart transportation system for Los Angeles County that improves both the roads and the environment will require the work of both the public and private sectors as well as concerned citizens and commuters. Visit the NDSC map to find out whether or not your neighborhood currently meets the EPA standards for healthy air and see whether or not the County has adopted an area plan near your community here.

Araceli Palafox
Araceli Palafox is a Master in Public Policy student at USC Sol Price of Public Policy. She attended the University of California, Santa Cruz and transferred to Loyola Marymount University where she graduated in 2016 with a degree in Political Science and Chicana/o Studies. Her research interests include immigration policy, environmental justice, education policy, and social justice.
Sources
California Office of Environmental Health Hazard Assessment. CalEnviroscreen 3.0 Report. 2017.
Frederico, Felicia et. al., Sustainable LA Environment Report Card. UCLA, 2017.
INRIX. Global Traffic Scorecard. 2017
Pop, CA et. al., Lung cancer, cardiopulmonary mortality, and long-term exposure to fine particulate air pollution. Journal of the American Medical Association, 2002.
Photo Attributions
Cover Photo: Photo courtesy of Istock/Richard Par
Photo 1: Photo courtesy of Istock/trekandshoot
Photo 2: Photo courtesy of Istock/Rene Der gregorian
Photo 3: Photo courtesy of Istock/trekandshoot
Photo 4: Photo courtesy of Istock/Csondy
Photo 5: Photo courtesy of Istock/Tero Vesalainen

