Life Expectancy in South Los Angeles
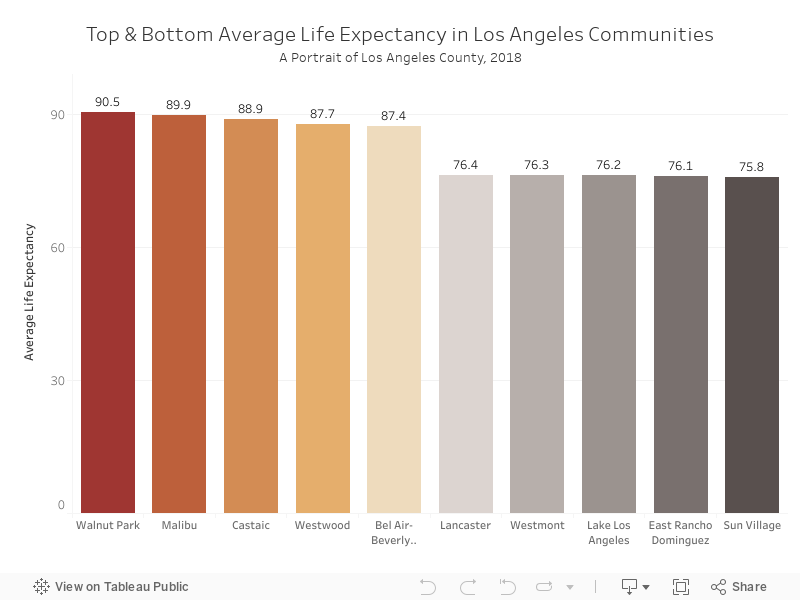
82 years. That is the average age a baby born in Los Angeles County can expect to live, which is a higher life expectancy than both the average Californian (81 years) and the average American (just under 79 years). However, average life expectancy alone can be a misleading indicator. Measure of America’s Portrait of Los Angeles County looked at life expectancy in its calculation of Los Angeles’s Human Development Index, and further analyzed variations in life expectancy by race and ethnicity, nativity, gender, and geography, providing an opportunity to explore how social, environmental, and economic contexts impact our ability to live long and healthy lives. The chart below shows the Los Angeles County communities with the highest and lowest life expectancy. Hover over a bar to see the community name and life expectancy.
Inequity Across Place
The Portrait of L.A. County shows us the manifestation of inequity across our communities. An analysis of life expectancy across local communities reveals stark disadvantages and vulnerabilities, many of which are rooted in historic (and ongoing) policies and practices, also known as “structural” and “systemic” inequities. Over time, interpersonal and institutional biases in policies and practices have tended to “sort” populations into resource rich and resource poor communities. For example, historical discriminatory housing practices such as redlining exacerbated racial and ethnic segregation, restricted access to decent housing and homeownership, and contributed to wide gaps in the allocation of educational resources that we see today in L.A. County.
The resulting community-level variability in social, environmental, and economic contexts greatly impact Angelenos’ overall wellbeing. Portrait of L.A. County’s interactive map shows this variability across 140 communities in the county.
Factors Affecting Life Expectancy
Variations in life expectancy stem from what public health professionals refer to as the social determinants of health. Such factors include everything from education levels, income, and employment to social connectivity and exposure to trauma, violence and crime. The impact of social determinants of health is not limited to life expectancy – they affect nearly all health outcomes.
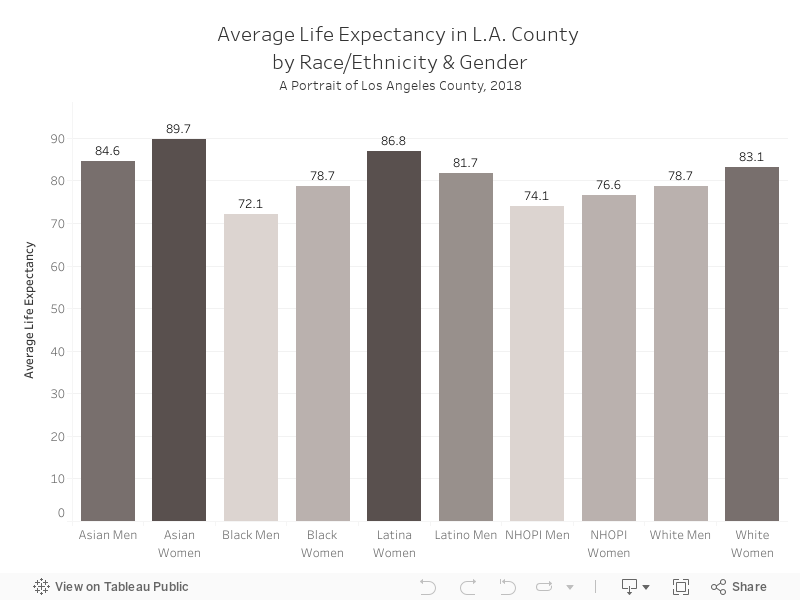
The Portrait of L.A. County found wide gaps in life expectancy across major racial and ethnic groups, demonstrating the profound impact of these social determinants of health. Asians have a life expectancy of 87 years, the highest of any racial or ethnic group, 12 years longer than the life expectancy of Native Hawaiian and Other Pacific Islanders (NHOPI) and Blacks. Paradoxically, Latinos have the second-highest life expectancy, at 84 years, outliving whites by more than three years, despite facing worse socioeconomic barriers. For more detail on life expectancy by race and gender, explore the chart below.
In addition to varying by race, life expectancy in Los Angeles also differs based on social, economic, and environmental factors that shape longevity and quality of life for Angelenos. The following comparison of two areas in South Los Angeles exposes a more nuanced representation of the factors contributing to life expectancy.
A Tale of Two Areas in South L.A.
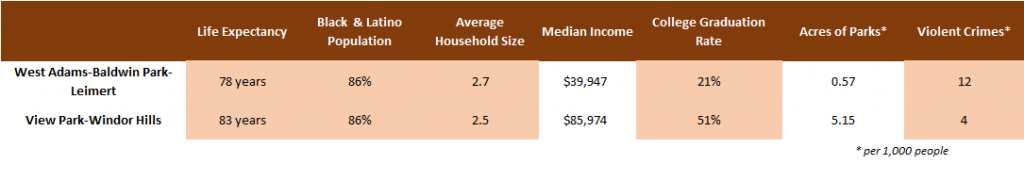
In the Portrait of L.A. County, West Adams-Baldwin Hills-Leimert and View Park-Windsor Hills are two neighboring areas in South Los Angeles with large Black and Latino populations and similiar household sizes according to 2016 American Community Survey (ACS) 5-year estimates. Both areas have an average household size of just under 3 people, and 86% of their respective populations identifies as Black or Latino. Despite their geographic proximity and demographic similarities, Portrait of L.A. County reports that life expectancy in the two areas differs by more than 4 years, with View Park-Windsor Hills’ life expectancy averaging 83 years while West Adams-Baldwin Hills-Leimert’s life expectancy rests at 79.


Some of the major determinants that may contribute to this gap include income and educational attainment levels. According to 2016 ACS 5-year estimates, View Park-Windsor Hills has a median household income of $85,974 – more than double that of West Adams-Baldwin Hills-Leimert ($39,947). A similar gap in college graduation rates exists between these two communities. Over half of View Park-Windsor Hills residents have a bachelor’s degree or higher level of education compared to just 21% of residents in West Adams-Baldwin Hills-Leimert.
According to an annual report on health in the U.S. published by the Center for Disease Control (CDC), households with higher income and education levels have lower rates of chronic diseases including obesity in both adults and children. Further, a study published in 2016 found that men in the highest one percent of the income distribution in the U.S. can expect to live almost 15 years longer than their counterparts in the lowest one percent of the income distribution. For women, the gap is just over 10 years. Many factors contribute to the gap in health outcomes across income and education levels, ranging from the ability to pay for preventative screenings and care to the way that doctors communicate with patients of differing socioeconomic statuses.
In addition to socioeconomic status, View Park- Windsor Hills and West Adams-Baldwin Hills-Leimert differ in other important ways that impact life expectancy. The Portrait of L.A. County identifies access to safe areas to exercise and play as an important social determinant of health. An 8-year study in Southern California found that children who lived closer to parks had significantly lower rates of obesity at age 18 than those who did not.

Although View Park-Windsor Hills and West Adams-Baldwin Hills-Leimert are neighboring communities, the residents of View Park-Windsor Hills have access to over 5 acres of parks per 1000 residents compared to just .57 acres in West Adams-Baldwin Hills-Leimert according to L.A. County Department of Parks and Recreation data. Neighborhood crime rates are also an important factor in people’s ability to use outdoor recreation spaces and on their psychological health. Residents in West Adams-Baldwin Hills-Leimert are exposed to violent crimes at three times the rate of residents in View Park-Windsor Hills. Further, the violent crime rate (crimes per 1,000 people) in West Adams-Baldwin Hills-Leimert has risen steadily from 8 in 2012 to 12 in 2016. In View Park Windsor-Hills, the violent crime rate decreased from 6 to 4 over the same period.
Disparities in life expectancy within these two areas can’t be explained by any one factor. However, the cumulative impact of these socioeconomic and environmental factors in View-Park Windsor Hills and West Adams-Baldwin Hills-Leimert chip away at the residents’ potential to live much longer and healthier lives.
Closing the Gap
The Portrait of L.A. County identifies several key social determinants of health that if addressed properly, would help reduce the disparities we see in life expectancy. Public officials have long advocated that interventions directed to individuals, such as programs to promote individual lifestyle changes or direct health services, have limited effectiveness for closing gaps in life expectancy absent of changes in the social, environmental, and economic conditions within communities like clean air and water, access to park space, and community safety. In addition, systems and policies that support better health such as greater economic security, access to transportation and affordable housing could significantly reduce gaps in life expectancy. The interrelated and inequitable nature of these health determinants highlights the importance of working to improve health outcomes across multiple policy areas.


In recent years, organizations and government agencies around the county have increased their focus on improving the health and well-being of Angelenos by directing resources and investments that impact the social determinants. The Healthy Design Workgroup convened by the Department of Public Health is a collaboration between multiple County departments dedicated to designing and building healthier community environments. Their achievements include increasing bicycle rack placement, providing resources to help residents grow their own food, and planting trees in tree-poor neighborhoods, among others. Measure H will help generate $355 million annually for services and prevention programs to combat homelessness. Metro’s recently adopted Equity Platform will help improve transportation access in historically disinvested communities. And, finally, LAUSD has exhibited great leadership in identifying new metrics to allocate money for high-need students. Investments to expand access to quality education, transportation, and housing are just some examples of how to strengthen the social determinants of health in underresourced areas.
A life expectancy of 82 years is a fantastic average. However, there are still glaring health inequities across major racial/ethnic groups and communities in Los Angeles County. Continuing to invest in programs that improve social determinants of health will help close these gaps and create a healthier, more equitable, and prosperous Los Angeles.
This story was created in partnership with Cheryl Wold (Wold and Associates, Pasadena, CA), consultant to the County of Los Angeles for A Portrait of Los Angeles County. For more information about A Portrait of Los County report, please reach out to contact@measureofamerica.org.
Sources
Center for Disease Control and Prevention. Social Determinants of Health: Know What Affects Health. 2018. Link.
Chetty, Raj., et al. The Association between Income and Life Expectancy in the United States, 2001 – 2014. Journal of the American Medical Association. 2016.
Lewis, Kristen. Burd-Sharps, Sarah. A Portrait of Los Angeles County. Measure of America. 2017.
National Center for Health Statistics. Health, United States, 2011. Link.
Neighborhood Data for Social Change, 2017. Link.
Wolch, J., et al. Childhood obesity and proximity to urban parks and recreational resources: a longitudinal cohort study. Health & Place. 2010.
Zimmerman, Emily. Woolf, Steven. Haley, Amber. Population Health: Behavioral and Social Science Insights. Agency for Healthcare Research & Quality. 2015. Link.
Photo Attributions
Cover Photo: Photo courtesy of Istock/Csondy
Photo 1: Photo courtesy of Istock/4kodiak
Photo 2: Photo courtesy of Istock/subman
Photo 3: Photo courtesy of Istock/halbergman
Photo 4: Photo courtesy of Istock/maroke
Photo 5: Photo courtesy of Istock/Merkuri2
Photo 6: Photo courtesy of Istock/Ron and Patty Thomas
