Transit
SLATE-Z was founded as a place-based, collective impact effort to strategically capitalize on neighborhood revitalization opportunities connected to transit-oriented development.
With the development of Metro’s “K” line on Crenshaw Avenue, the community saw an opportunity to examine and harness the economic impacts that the “K” line would bring to the region, and decided to work together for the benefit of the historic community.
Transit provides access to life’s opportunities and can also aid in the reduction of greenhouse gas emissions and the environmental harm that has plagued South Los Angeles. Effective transit-oriented solutions in South Los Angeles stimulate economic activity and provide equitable access to education, workforce development, wellness opportunities, and more.
Key Takeaways
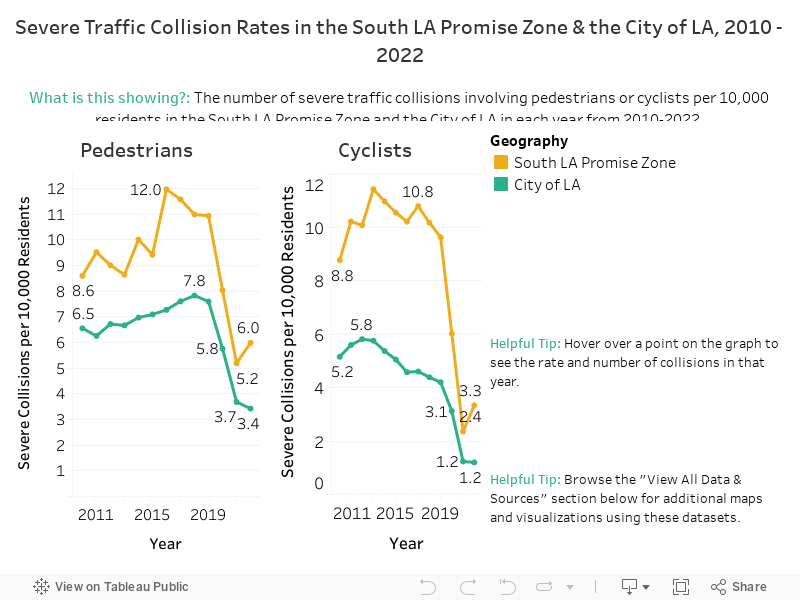
Severe Collisions with Pedestrians
2,645
There have been 2,645 severe collisions between vehicles and pedestrians in the South LA Promise Zone from 2010 to 2022.
Over the last decade, the rate of traffic collisions with pedestrians has been consistently higher in the South LA Promise Zone than the City of Los Angeles average.
Severe Collisions with Cyclists
2,516
There have been 2,516 severe collisions between vehicles and cyclists in the South LA Promise Zone from 2010 to 2022.
Over the last decade, the rate of traffic collisions with cyclists has been consistently higher in the South LA Promise Zone than the City of Los Angeles average.
59%
59% of collisions with cyclists in the South LA Promise Zone happen on streets without a bike lane.
Severe Traffic Collision Rates in the South LA Promise Zone & the City of LA, 2010 - 2022
Fareless Transit Pass Enrollment
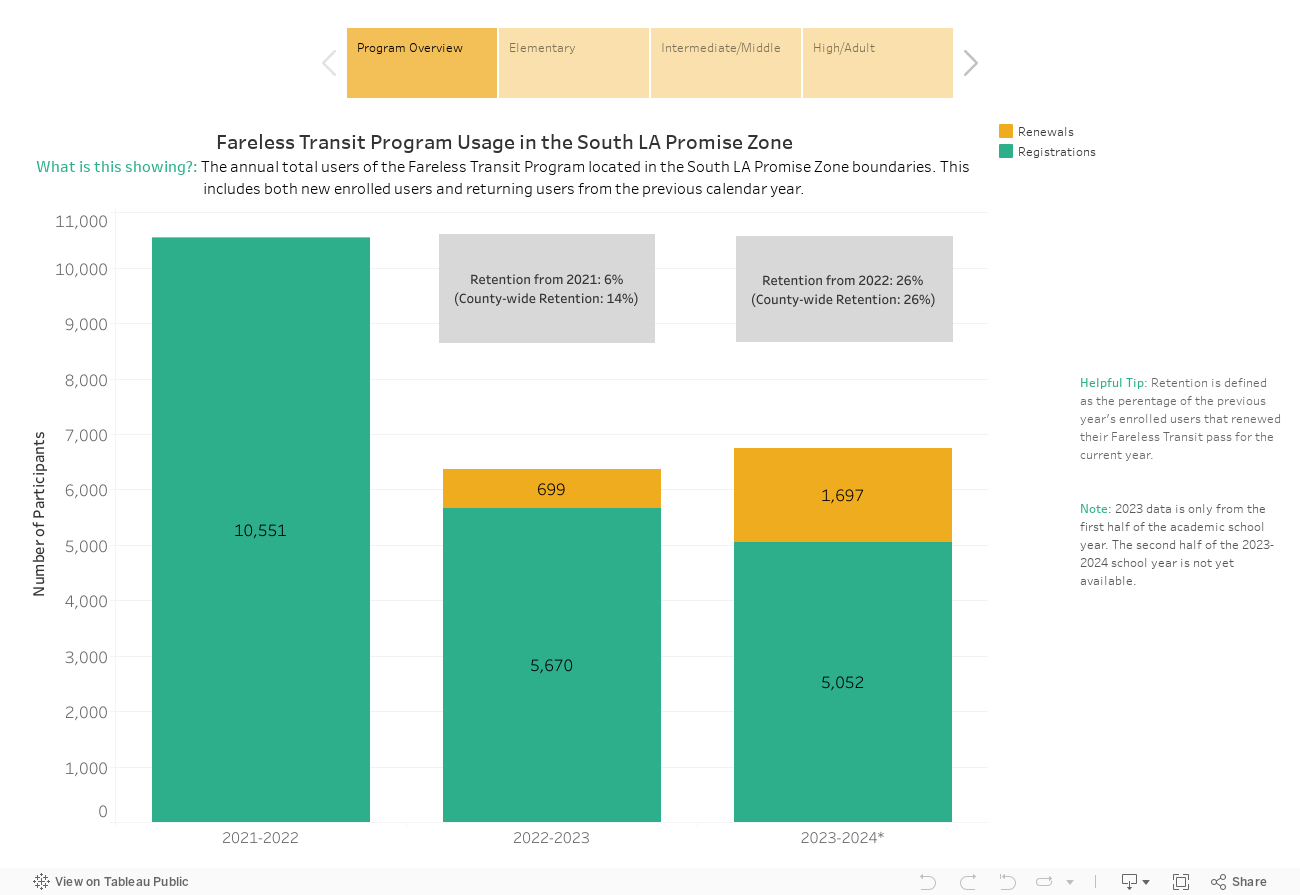
- After the program launched in the middle of the 2021-2022 school year, nearly a quarter of students in South LA Promise Zone schools enrolled in the Fareless Transit program.
- In the second year of the program (2022-2023), just 6% of students in South LA Promise Zone schools renewed their enrollment compared to 14% of students countywide.
- High school students enroll in the program at higher rates than elementary and middle school students in the South LA Promise Zone.
Source: LA Metro Fareless System Initiative
Notes:
Fareless Transit data was forwarded for the entire county. Data was cut down to schools within the South LA Promise Zone boundaries, and totals were aggregated.
Schools that serve any grade between K-5 are designated as elementary schools. Schools that serve any grade between 6-8 are designated as middle/intermediate schools. Schools that serve any grade 9 and up are designated as high/adult schools. Schools that serve multiple age groups are included in every category for which they have students (e.g. a school that serves grades K-8 is included in both the “Elementary School” and “Intermediate/Middle School” tabs).
Each tab displays a line for the “South Los Angeles Promise Zone Schools.” This line is the aggregate registration for all of the schools in that tab’s grade level designation.
Fareless Transit Pass Usage
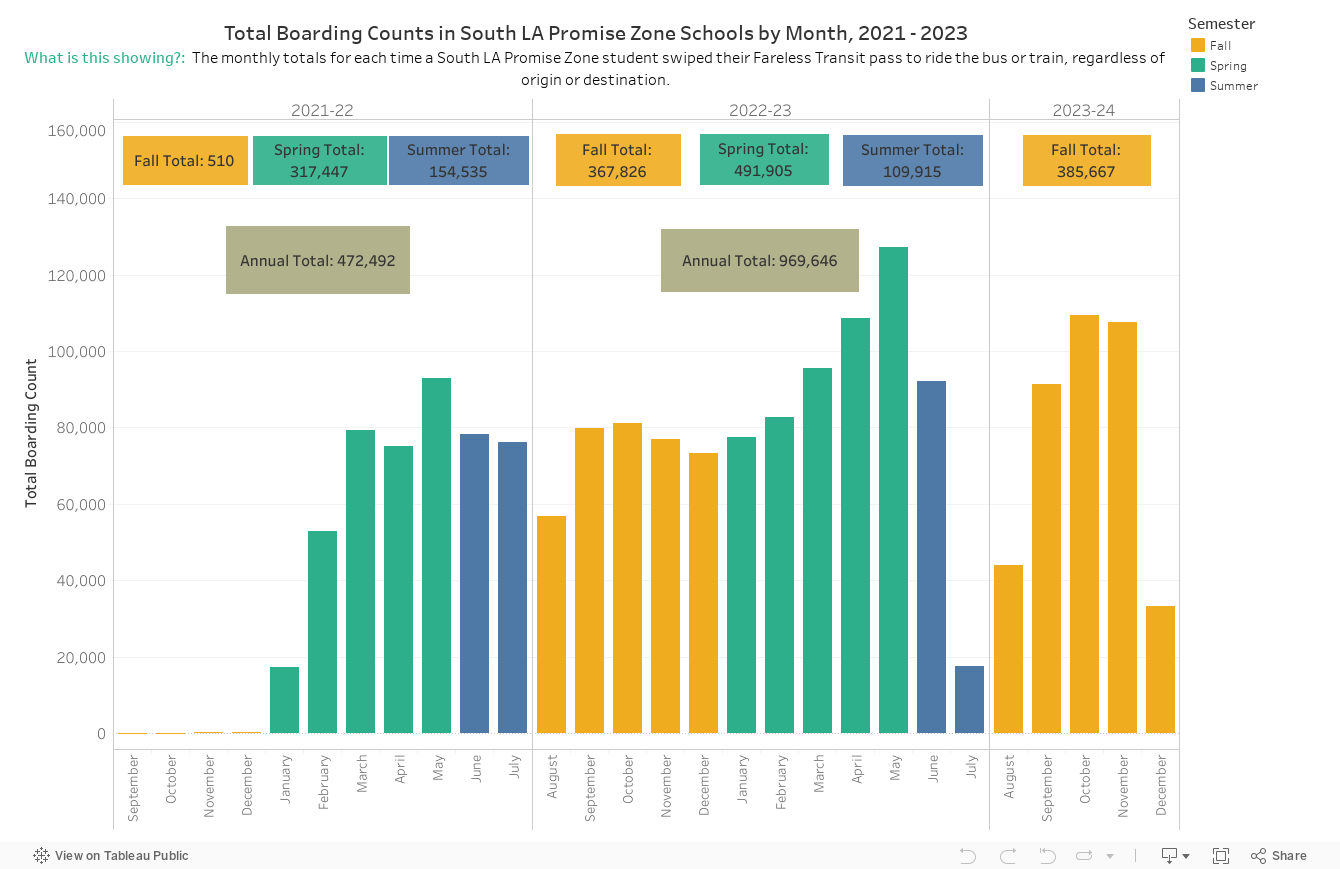
- Students attending schools in the South LA Promise Zone swipe their Fareless Transit Passes more frequently during the school year than the summer months.
- After launching in the middle of the 2021-2022 school year, program usage increased during the 2022-23 school year. South LA Promise Zone students swiped their passes nearly 970,000 times during the 2022-23 school year.
- Boarding data for the 2023-24 school year is incomplete, but the numbers are on pace to surpass previous years.
Source: LA Metro Fareless System Initiative
Notes:
Fareless Transit data was forwarded for the entire county. Data was cut down to schools within the South LA Promise Zone boundaries, and totals were aggregated.
Cyclist Safety
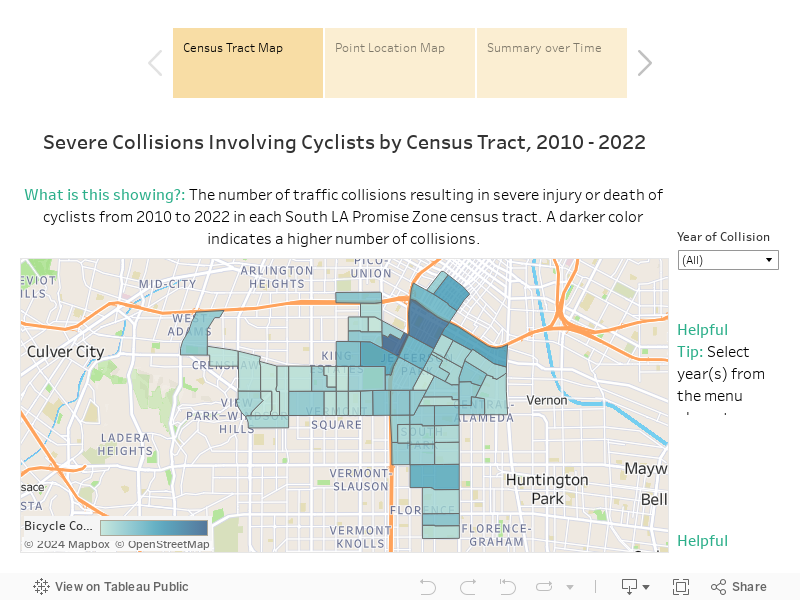
- Over the last decade, the rate of traffic collisions with cyclists has been consistently higher in the South LA Promise Zone than in the larger City of Los Angeles.
- From 2017 to 2021, the number of collisions with cyclists in the South LA Promise Zone has been steadily decreasing. However, this number slightly increased from 2021 to 2022.
- The majority (59%) of collisions with cyclists in the South LA Promise Zone happen on streets without a bike lane.
Sources
HIRE LA Youth work experience enrollments are tracked and reported in the CalJOBS platform. Data for the South Los Angeles Promise Zone zip codes is provided by the Los Angeles Economic & Workforce Development Department (EWDD). EWDD estimates that CalJOBS provides an underestimate of the actual number of enrollments through Hire LA Youth due administrative reporting gaps.
Definitions
Youth Work Experience Enrollments: HireLA Youth participants enrolled in subsidized work experience opportunities in the CalJOBS system
“HIRE LA focuses on preparing young adults for the 21st Century workforce. It is designed to provide a starter job for youth ages ages 14-24. HIRE LA is funded by multiple sources and used to provide work experience, as well as work skills development, financial literacy, career coaching and mentoring, and career exposure. HIRE LA programming provides youth with the preparedness needed to enter the workforce and sets them on a path of becoming lifetime earners.”
(from HIRE LA Youth via https://www.hirelayouth.com/).
Pedestrian Safety
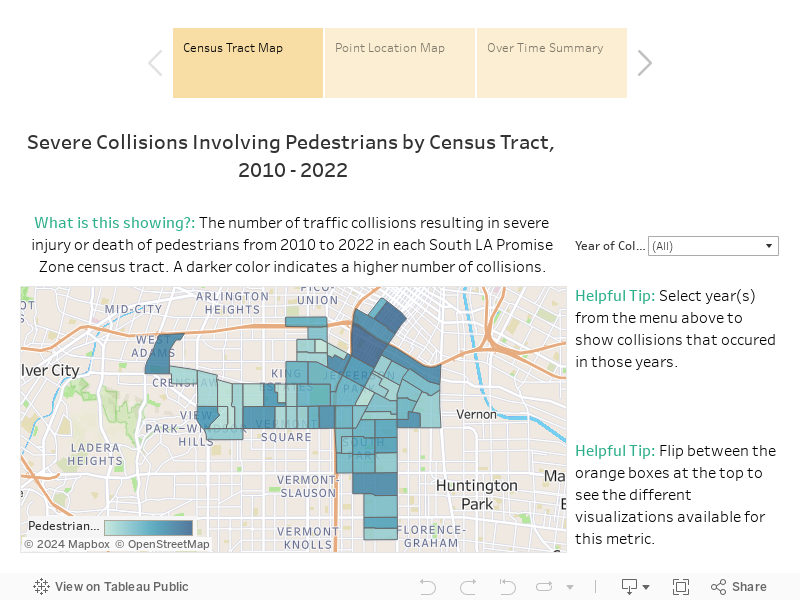
- Over the last decade, the rate of traffic collisions with pedestrians has been consistently higher in the South LA Promise Zone than in the larger City of Los Angeles.
- From 2016 to 2021, the number of collisions with pedestrians in the South LA Promise Zone has been steadily decreasing. However, this number slightly increased from 2021 to 2022.
Traffic Collisions: California Statewide Integrated Traffic Records System (SWITRS)
Resident Population: American Community Survey (ACS) 5-Year Estimates
Tree Cover
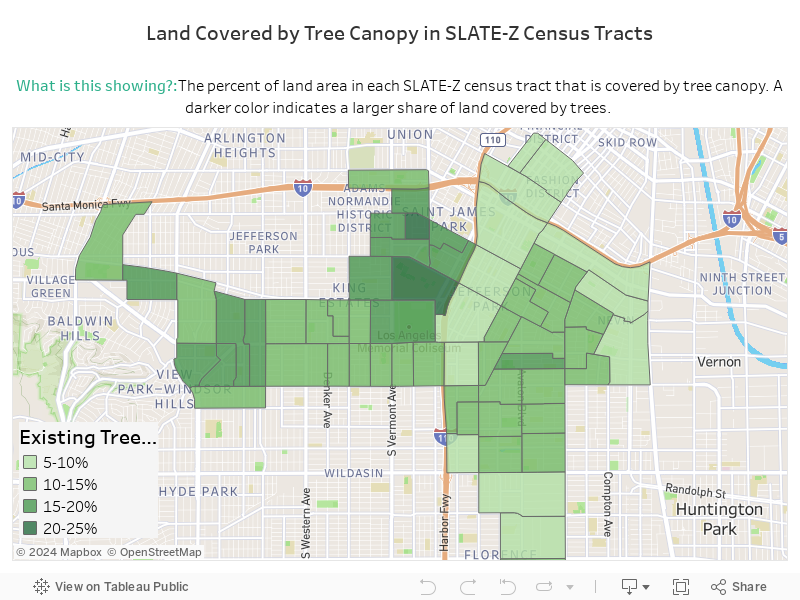
- 12% of land in the South LA Promise Zone is covered by tree canopy compared to 25% of land across the City of Los Angeles.
Source: Los Angeles County Tree Canopy Map Viewer by Tree People and the Center of Urban Resilience (CURes) at Loyola Marymount University (LMU)
Notes:
Data gathered in 2016.
Possible Tree Canopy includes areas that are theoretically available for the establishment of tree canopy. This category includes both pervious areas (lawns, gardens, parks, etc) and impervious areas (asphalt or concrete surfaces, excluding roads and buildings) where improvements could ostensibly be made to accommodate additional trees.
Learn more about this data from the original source:
The Journey to the Los Angeles County Tree Canopy Map Viewer
