
Table of Contents
Key Insights
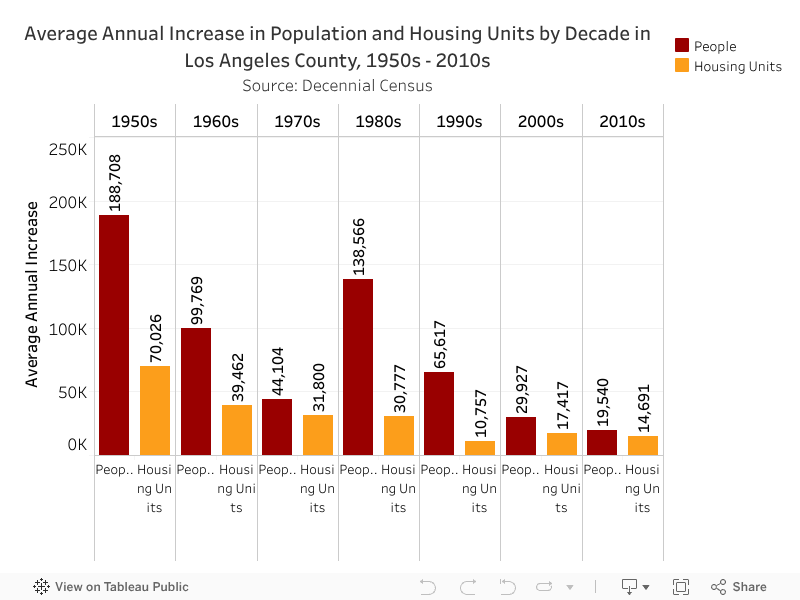
- Housing production has dropped significantly since the 1950s, even as the County of Los Angeles’s population has continued to grow.
- In 2025, 19% of new rental units were affordable to low-income households. This is higher than the share of affordable new rental units over the prior seven years, which was only 10%.
- Despite a slight dip in overall housing production from 2024 to 2025, growth in Accessory Dwelling Units (ADUs) continued; 2025 marked the highest annual total of new ADUs to date. Despite this source of housing growth, Los Angeles County continues to fall well short of its state-mandated housing goals.
- About 6.7% of the county’s rental housing stock is subsidized by federal or state programs – far lower than in some other major U.S. cities like New York. Subsidized units here are disproportionately concentrated in lower-income neighborhoods.
- The number of Permanent Supportive Housing beds has increased by nearly 70% since 2017.
Note: This chapter is based largely on administrative housing data, as of 2025 and, in some places, 2026, drawn from various sources (see Data & Methods). In the rest of the report, 2024 is the most recent year of data available.
The County of Los Angeles’s housing crisis is largely a product of its persistent failure to build enough housing. For decades, the region has added far fewer homes than needed, especially for its large population of low- and middle-income residents, reflecting its fragmented and inefficient approach to housing production. Building new units is expensive to finance and slow to deliver., and units’ prices are often out of reach for the people who need them most. Research has shown that Los Angeles has one of the weakest relationships between housing demand and housing production among major U.S. metro areas; even when prices rise, new housing supply is slow to follow (Baum-Snow & Han, 2024; Gyourko & Krimmel, 2021).
This chapter begins by placing today’s housing production in a historical context, showing how construction volumes have declined sharply over the decades, even as the county’s population has continued to grow. It then examines new housing production across Los Angeles County: what kinds of units are being built, where they’re being built, who they’re serving, and how long it takes to bring them online. The chapter also highlights the systems and structures that shape supply, underscoring how rising construction costs, slow construction timelines, and limited, complex public subsidies stymie production.
An Aging Housing Stock
Last year’s edition of SOLACHAN laid out the historical trends that led to Los Angeles County’s present-day housing shortage. The 1970s saw less federal funding for public housing, reduced local government revenue, and rising land and construction costs; these factors all contributed to a substantial slowdown in the county’s housing production.
Decades of limited housing production have resulted in Los Angeles County’s housing stock being older than both the state and national averages. The median age of the county’s housing stock is 58 years old (built in 1966)1: 11 years older than the state median and 16 years older than the national median. On average, owner-occupied homes in Los Angeles County are 8 years older than renter-occupied ones. In contrast, owner- and renter-occupied housing stocks in California and the U.S. are roughly the same age. The median age of housing units in the city, county, state, and nation is displayed in the chart below.

Current Trends in Countywide Housing Production
Each year, cities and unincorporated areas across California are required to submit a Housing Element Annual Progress Report to the California Department of Housing and Community Development (HCD), reporting their progress in meeting local housing production goals. This section measures new housing production in Los Angeles County between 2018 and 2025, based on reported numbers of Certificates of Occupancy (C of Os) for new units (California Department of Housing and Community Development, 2021).2
Most New Units Are Market-Rate Rentals, but Affordable Units Are Slowly Rising
Between 2018 and 2025, over 179,400 new housing units were certified for occupancy, meaning they complied with building and safety codes and a resident could legally move in. Of these units, about 149,800 (84%) were designated as rental units and about 29,500 (16%) were owner-occupied units – compared to the current county split of 54% rental, 46% homeowner – continuing the widening age gap between the renter- and owner-occupied housing stock in the county.
In some cases, a new unit certified for occupancy may be replacing an existing unit, and these “teardown” properties disproportionately skew towards the owner-occupied housing supply. California accounted for 13% of the nation’s demolition permits in 2025, trailing only Florida (National Association of Home Builders, 2026). According to the HCD 2018-2025 data, approximately 14% of owner-occupied properties reported demolishing at least one unit; for renter-occupied properties, the figure was just 1%.
43% of these instances occurred in 2025 alone, in part due to the Eaton Fire in Altadena and the Palisades Fire in Pacific Palisades. Following the fires, emergency measures helped streamline permitting and expedite review processes that reduced the overall time required for demolition and rebuilding (see Emergency Executive Order No. 1 for the City of Los Angeles and Like-For-Like Rebuild for Los Angeles County). These policy changes likely contributed to the sharp increase in teardown activity.
Altadena moved through the recovery process more quickly than Pacific Palisades: Demolition and new construction increased simultaneously, whereas the Palisades experienced similarly rapid demolition but comparatively less new construction (Friberg, 2026). The HCD data corroborates this: In 2025, 60% of new units replacing an existing unit occurred in unincorporated Los Angeles County, the jurisdiction that Altadena falls under.
Looking specifically at the nearly 149,900 new rental units produced during this period, just over 17,000 (11%) were affordable to low-income households, meaning an occupant making less than 80% of the median income would not spend more than 30% of gross household income on housing costs. Of these, about 7,740 were considered affordable to Extremely Low Income (ELI) and Very Low Income (VLI) households (making less than half of the area median income)3 and about 9,300 new units are affordable to Low Income (LI) households (making between 50-80% of the area median income).4
Estimates on the shortage of affordable housing in Los Angeles County vary:
- Neighborhood Data for Social Change estimates a shortfall of over 578,000 rental units for households making less than 50% of area median income, including people currently experiencing homelessness.
- The Regional Housing Needs Assessment (RHNA) mandates that over 340,000 new units affordable to households earning less than 80% of area median income be built between 2021 and 2029 (Southern California Association of Governments, 2021).
Regardless of the methodology or source cited, it’s clear that Los Angeles County is falling well short of producing enough affordable housing to meet the current need.
In 2025, 19% of new rental units in Los Angeles County were affordable to low-income households, the highest share of new affordable rental housing in a given year on record. This share amounted to nearly 4,500 new affordable units, the most in a given year on record (see rental units over the years in the chart below). The increase in new affordable units mirrors a broader increase in all new housing units certified for occupancy in recent years. This trend is discussed in more detail in the following sections.

Accessory Dwelling Units (ADUs) Continue to Drive Growth
Across all units, fewer than 20,000 new housing units were certified for occupancy in both 2018 and 2019, reflecting the slow growth of the housing stock during the 2010s. Beginning in 2020, however, housing production rose, peaking at around 28,500 units in 2024. This number dipped slightly in 2025, with about 27,300 new housing units certified.
A large portion of the increase in new housing production over the last few years is driven by the construction of Accessory Dwelling Units (ADUs), secondary housing units (that must include a kitchen and a bathroom) on a land parcel with previously existing housing. In 2018, just 9.5% (1,624) of all units certified for occupancy in LA County were ADUs. But between 2022 and 2025, ADUs accounted for one-third (around 34,150 ADUs) of all new Certificates of Occupancy. ADUs made up 37% of total new housing units in LA County in 2025, higher than any other year in the data.5 See the increase in ADUs certified for occupancy over time in red on the chart below.

Note: Chart above excludes 250 mobile home units across years.
The State of California and Los Angeles County, like many other jurisdictions, have prioritized increasing the construction of Accessory Dwelling Units (ADUs) as a key strategy for relieving housing market pressures, as they offer a cost-effective, flexible way to add homes within existing neighborhoods, often without major new infrastructure.
- At the state level, laws such as SB 1069 (2016) and AB 68 (2019) streamlined ADU approvals, removed minimum lot size and parking requirements, and allowed multiple ADUs per lot. More recently, AB 1033 (2023) expanded ownership opportunities by authorizing cities to allow ADUs to be sold separately from the rest of a given parcel, and SB 1211 (2024) expanded multifamily-lot ADU rights by allowing more detached ADUs on multifamily properties and easing replacement-parking rules when converting parking to ADUs.
- Locally, the City of Los Angeles adopted Ordinance 186481 (2019) to launch a Standard Plan Program offering pre-approved ADU designs to simplify permitting, and Ordinance 184,907 (2017) to simplify the process for legalizing existing unpermitted ADUs. Later, AB 2533 (2024) effectively generalized statewide what the City’s 2017 UDU Ordinance 184907 pioneered locally for unpermitted units.
- Los Angeles County has also updated its zoning code to speed up ADU development in unincorporated areas.
For a full list of recent legislation relevant to Accessory Dwelling Units, please see this list.
In response to widespread damage to housing structures in the Palisades and Altadena, both the state of California and the City of Los Angeles enacted legislation to speed up recovery efforts.
- Executive Order N-4-25 suspended the California Coastal Act and CEQA review requirements for like-for-like rebuilds in the fire-affected area.
- Locally, Emergency Executive Order 1 expedited city department review processes for rebuilding damaged units and waived certain environmental/hearing requirements. Emergency Executive Order 7 suspended or waived city permit fees for repair, restoration, demolition, or replacement of fire-damaged property.
The 21st Century ROAD to Housing Act (H.R. 6644, Pub. L. 119-101) became law in July 2026, the first major federal housing package in over 30 years. Aimed to increase housing supply, the legislation expands financing for housing development, streamlines regulatory processes, raises loan limits and investment caps, opens avenues for manufactured and modular housing, and creates incentives for state and local governments to permit more housing. This legislation incentivizes localities to increase housing production by accelerating various processes. In Los Angeles, easier second-lien financing for ADUs could accelerate homeowner-built ADUs, and higher FHA multifamily loan limits could support larger LIHTC/affordable projects in LA County. However, this legislation does not preempt local land-use and zoning authority; Los Angeles’ local zoning, land costs, and construction costs still remain the primary drivers of local housing shortages (Baker Botts, 2026).
Despite the potential benefits of ADUs, the proportion of LA County property owners who list their ADUs in the traditional rental market remains unknown. A 2024 report focused in Council District 3 (located in the western side of San Fernando Valley) found that most ADUs were not intended to be rental units available to the broader market: 70% of respondents said their primary reason for constructing the ADU was either “to house a family member or close relative” or “to provide extra recreation, work, or living space” instead (Cressy, 2024). About half of the ADUs tracked during the survey period were vacant; among those with a tenant, 67% had some form of familial relationship with the homeowner. On a broader scale, this may suggest that ADUs do not contribute to the housing stock in the same way new single- or multifamily units do. And although ADUs add to overall supply, they are not significantly contributing to affordability: 92% of new ADUs certified for occupancy were designated as affordable to Above Moderate Income households only.6
Other than ADUs, new housing production in Los Angeles County remains limited. Between 2018 and 2025, the number of certifications for non-ADU units never exceeded 20,000 in any single year.
The City of LA Has Led the Way, but Other Cities Are Catching Up
Between 2018 and 2025, the City of Los Angeles certified 329 new units per 10,000 residents, a higher concentration than nearly every other county jurisdiction, except for Rolling Hills Estates, Duarte, and Hidden Hills. The City of Los Angeles stands out not only for its per capita rate but also for its volume, with over 126,000 units certified during this eight-year period; no other jurisdiction certified more than 8,000 units in this same period.
Rounding out the rest of the top 10 jurisdictions by per capita production were Monrovia (295), West Hollywood (241), Malibu (225), and Pasadena (219), though not all contributed housing that supports broader affordability goals. For example, Hidden Hills did not certify a single new rental unit between 2018 and 2025. The chart below shows the jurisdictions with the highest per capita housing production during this period. Use the filter on the right-hand side to explore additional jurisdictions.

The California state government determines each region’s housing need through the Regional Housing Need Determination (RHND), which is based on projected growth, existing need, and equity factors. The Southern California Association of Governments (SCAG) then allocates this need among local jurisdictions through the Regional Housing Needs Assessment (RHNA). Each jurisdiction, including those in Los Angeles County, is required to develop a Housing Element – a component of its general plan – that outlines how it will accommodate its designated share of new housing, through zoning changes and other policies. This process is mandated to be completed every eight years; the current cycle covers 2021-2029.
Although the City of Los Angeles continues to account for a disproportionate share of housing production, other jurisdictions across the county have begun to step up. In 2025, 68% of all units certified for occupancy countywide were in the City of Los Angeles – down from 81% in 2018, but up from 62% in 2024.7 This shift reflects a modest but notable increase in housing production in other cities.
Although this upward trend is encouraging, the scale of production still falls far short of what’s needed. Under the current Regional Housing Needs Assessments (RHNA) cycle, jurisdictions in Los Angeles County must collectively permit 812,060 new units by October 15, 2029 – a goal that remains well out of reach based on current projections. Explore the dashboard below to see how each of Los Angeles County’s jurisdictions is faring in reaching their goals. Add a city to the chart using the menu on the right.8

The City of LA’s Permit-to-Occupancy Timelines Are Not Improving
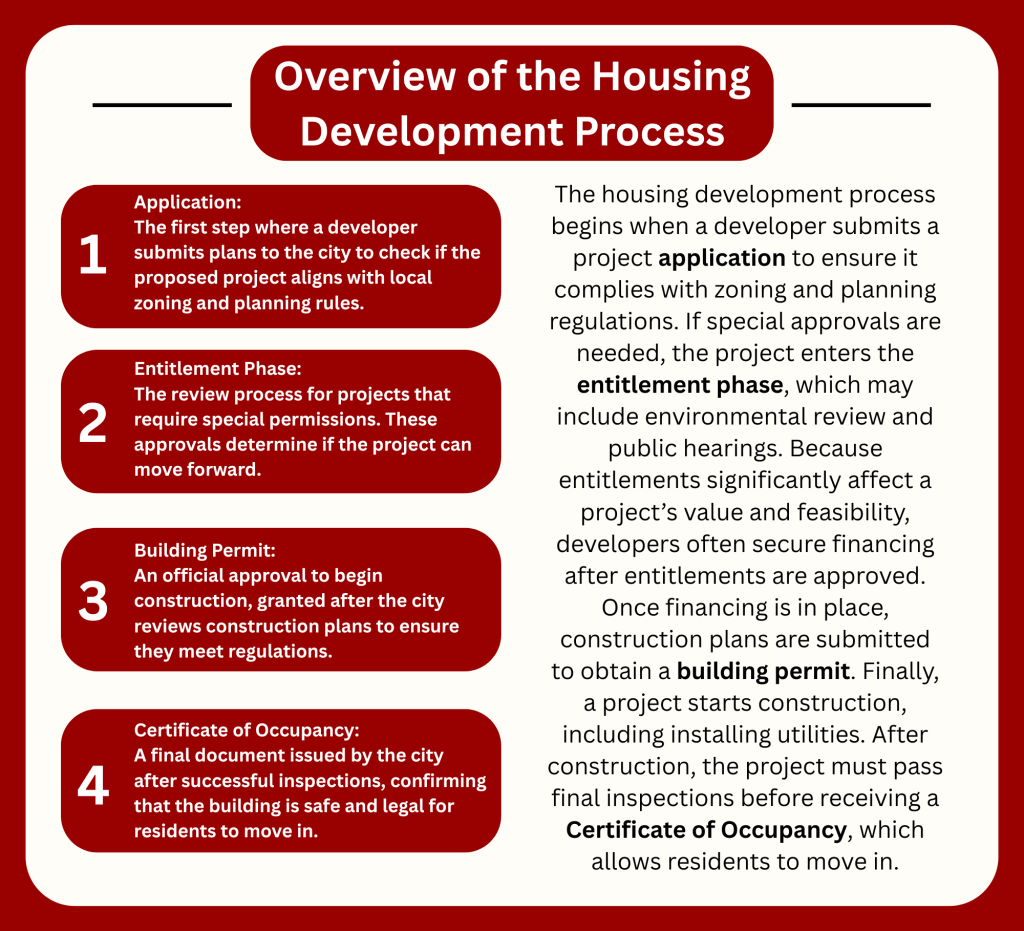
This section examines how long it takes for new housing in the City of Los Angeles to move through the final phase of development, from the building permit (step 3 in the diagram above) to the Certificate of Occupancy (step 4). Over the past eight years, nearly three-quarters of all housing built in the county was produced in the city.9
On average, it takes just over 19 months for a new housing development in Los Angeles to go from permit to completion. Nationally, that process averages just 4-6 months (Construction Coverage, 2025).
In Los Angeles, owner-occupied units took longer (22 months) to move from permit to Certificate of Occupancy on average than rental units (18 months), which may reflect more opportunities for standardization in rental construction. Even ADUs – smaller, simpler, single-unit structures – still average almost 18 months between initial permitting and Certificate of Occupancy. The average times to completion for these categories all increased by one month with the addition of 2025 data to this analysis. Notably, larger projects of either 2-4 units or 5+ units increased in average permit-to-completion time by more than two months, exceeding the increase observed among single-unit projects. Multifamily projects (with five or more units) now take a staggering 37 months from permitting to completion on average. The chart below shows average permit-to-completion times by tenure and property size.

Contrary to popular belief, construction timelines for affordable units in the city are not uniformly longer than those for market-rate projects of comparable size. Although affordable 2-4 unit properties took an average of two months longer to complete than their market-rate counterparts, they represent only a small share of all affordable units built in Los Angeles. Most affordable housing developments are multifamily buildings with five or more units. For these types of buildings, construction timelines are actually shorter than for comparable market-rate projects.
As shown in the chart below, affordable multifamily (5+ unit) developments moved from permitting to completion over one month (37 days) faster than comparable market-rate projects. However, these large developments still take nearly three years to complete, on average.

The City of Los Angeles’s Executive Directive 1 (ED1), passed in 2022, streamlines the permitting process for 100% affordable housing projects. However, its impact on delivery will be limited if construction timelines, particularly for large multifamily developments, remain measured in years rather than months. Because the vast majority of affordable housing in Los Angeles is built as multifamily properties, tackling the overall slow pace of multifamily construction is essential to meeting the region’s housing affordability goals.
Developer Recommendations for Improving Building in Los Angeles
In August 2025, the Lusk Center for Real Estate administered a non-representative survey to Southern California housing developers and investors in its network to assess barriers to developing housing in Los Angeles County. Two out of every three developers have an unfavorable view of Southern California’s current market conditions. Just like last year’s survey, top concerns included time (long delays in entitlements, permitting, and utility installation), costs (construction, labor, and material costs; impact fees; insurance; and high interest rates), and regulations (the California Environmental Quality Act (CEQA), Measure ULA, zoning, and land use requirements).
This year’s survey included questions not only for multifamily developers but also for investors, expanding on last year’s survey’s reach. Three out of every five investors have an unfavorable view of Southern California’s current market conditions, reporting below-average investment activity (both acquisitions and disposals) in the past couple of years. The biggest reported challenges included permanent debt financing and high property insurance premiums.
Lastly, affordable housing developers suggested these specific ideas to improve current subsidies or programs:
- Increasing project-based vouchers
- Loan programs with a higher Loan-to-Cost (LTC) ratio with a non-repayment period until the project is stabilized
- One agency that manages all public finance of housing
Subsidized Housing Inventory in Los Angeles County
Because affordable housing developments generate less rental revenue per unit, they often require external subsidies to close financing gaps. This section focuses on the major federal and state programs currently used to subsidize housing for low- and middle-income renters in Los Angeles County, as well as subsidized housing options for people experiencing homelessness. Future editions of SOLACHAN will include data on local housing affordability/subsidy programs to provide a more comprehensive view of the subsidized and incentivized housing landscape in Los Angeles County.
Federal and State Subsidized Housing Makes Up Less Than 7% of Rentals
The Low Income Housing Tax Credit (LIHTC) program is the primary vehicle for federally incentivizing affordable housing construction and preservation nationwide, including in LA County. State agencies like California’s HCD have become essential partners in delivering LIHTC-funded units, offering companion financing to meet federal affordability standards and fill local funding gaps. Localities may also offer similar bridge-funding programs (e.g., the City of LA’s Affordable Housing Managed Pipeline fund). Developers often combine LIHTC with other state subsidies and local capital to create complex “layer cakes” of funding, a model that can lead to high administrative burdens and vulnerability to policy changes that occur across the multiple layers of government. High development costs, the need for capital to achieve deeper affordability, and scattered funding sources available across government agencies make layered financing common in LA (Kneebone & Reid, 2021). Combined with broader housing production challenges in the region, this complexity has contributed to Los Angeles County’s relatively low stock of federally and state-subsidized housing.
In LA County, there are an estimated 2,160 multifamily rental properties that contain units with active subsidies, assistance, or incentives provided through federal and state programs; these properties contain a total of 148,600 units, of which at least 132,600 are supported through these programs, and the majority of them are already built, as opposed to in the construction pipeline. Moreover, some of these properties are fully affordable, while others contain a mix of affordable and market-rate units.10 The 132,600 federally- and/or state-subsidized units represent roughly 6.7% of LA County’s existing rental housing stock.11 By comparison, units in federally and state-subsidized properties comprise approximately 23% of the rental housing stock in New York City (NYU Furman Center, n.d).12
LIHTC properties account for about 71% of non-public housing properties (1,468 of 2,081) actively receiving a subsidy from federal or state programs across the county.13 About one-third of LIHTC-funded properties in LA County also draw on other federal or state funding sources, such as HUD Multifamily Assistance and Section 8 contracts, as well as programs administered by HCD or the California Housing Finance Agency.
Supply-side subsidies or programs provide funding or incentives directly to developers or landlords to help with the construction, preservation, or rehabilitation of housing units. Many of the supply-side affordable housing programs are project-based (or site-based). In exchange for subsidies or incentives, developers typically need to set aside a specific number of units for lower-income households. When renters move out of these units, the project-based subsidy remains tied to the unit and continues to serve eligible households until the affordability requirement expires. Some examples of supply-side subsidies:
- HUD Section 8 Project-Based Rental Assistance
- Low Income Housing Tax Credits (LIHTC)
For the full list of supply-side programs covered in this chapter, please refer to the Subsidized & Incentivized Housing methodology section in the Data & Methods page for details.
Demand-side programs help renters directly with their housing costs. The rental assistance is tied to the household rather than to a specific unit. Renters can use the subsidy toward an eligible rental unit on the private market. When renters move to a different eligible unit, the subsidy can potentially move with them. Some programs, such as Housing Choice Vouchers, help cover rent so that renters pay no more than 30% of their income toward rent. However, if the rent exceeds the program’s payment limit, households may need to cover the gap out of pocket. Some examples of demand-side subsidies:
- Tenant-Based Housing Choice Voucher (HCV). The next callout box in the chapter will provide more information regarding the HCV program.
- Tenant-Based Permanent Supportive Housing Beds
LA Barometer, a longitudinal survey designed to be representative of LA County residents, provides a clearer view of the households receiving housing assistance in the county. According to the survey, about 12% of renters in LA County receive some form of supply- or demand-side housing assistance. For more information on the LABarometer survey data, see the Data & Methods section.
In this section, we assess the renter household characteristics of major federal supply programs, including public housing, Project-based Section 8, and HCV, and compare them with those of renters receiving any housing assistance and all renters.
Overall, Black renters account for a larger share of households receiving housing assistance than of the renter population as a whole. Almost half (46%) of the HCV households are headed by a Black renter, compared to just 11% of all renters in the LA Barometer sample.
Housing assistance programs also serve a disproportionately older population, particularly through the major federal programs. 77% of the Project-based Section 8 households are headed by adults 62 or above. Households headed by older adults make up 42% and 46% of the public housing residents and HCV recipients, respectively. LA Barometer’s survey suggests that renters receiving other types of housing assistance are less likely to be age 62 or older.
In terms of household composition, public housing has a slightly higher share of households with young children (12%) than the overall renter population (11%), while HCV households have a somewhat lower share (8%), and project-based Section 8 households have the lowest share (4%).
% Household head, Black | % Household head, older adults (62 or above) | % Households with children 0-5 | |
Public Housing Renters | 28% | 42% | 12% |
Project-based Section 8 Renters | 18% | 77% | 4% |
Housing Choice Voucher Renters | 46% | 46% | 8% |
LA Barometer’s Assisted Renters | 35%* | 30%* | 18% |
LA Barometer’s All Renters | 11%* | 11%* | 12%** |
ACS All Renters | 11% | 20% | 11% |
* These data cells report the percentage of renters and assisted renters who are Black or 62+.
** In this specific cell, we report % households with children 0-4, due to data availability.
In response to the complexity of financing affordable housing through federal and state programs, new policies and program designs have emerged to shorten financing timelines and reduce project costs. At the state level, California Governor Gavin Newsom signed AB 179 (2026) with reforms to streamline housing financing for affordable housing development. At the local level, the Los Angeles County Affordable Housing Solutions Agency (LACAHSA) announced the LACAHSA Mortgage program, a “one-stop shop” offering low-cost financing to cover up to 90% of development costs, funded by Measure A (LACAHSA, 2026).
The Los Angeles County Affordable Housing Solutions Agency (LACAHSA) is a newly established regional agency focusing on housing affordability in LA County. After the California Legislature passed SB 679 (2022) to create the agency, it officially launched on January 1, 2023. The agency is governed by a board of directors that includes policymakers, community leaders, and housing production experts.
LACAHSA’s three priority areas are (LACAHSA, 2026):
- Renter Protection and Homelessness Prevention: focusing primarily on preventing displacement and improving tenant stability
- Production, Preservation, and Ownership: expanding and preserving the County’s housing supply
- Technical Assistance: building capacity and sharing the knowledge and skills to accelerate housing production and homeless prevention, and seed innovation.
Across these priority areas, LACAHSA incorporates equity considerations into its program design to reduce racial disparities and better serve Angelenos disproportionately affected by housing instability and affordability issues.
Currently, LACAHSA relies on Measure A revenues, around $380 million per year, to fund various housing programs and its own operations. As a regional agency, it allocates the program funding to its 13 eligible jurisdictions in LA County. Most of the funding (60%) is designated for affordable housing creation, preservation, and ownership. Another third is allocated to renter protection and homelessness prevention. The remaining funding pool is split evenly between technical assistance and administrative costs.
Although most affordable housing programs have subsidized or incentivized private development, public housing remains an important part of the County’s affordable housing portfolio. Los Angeles County has approximately 9,000 traditional public housing units managed by the Los Angeles County Development Authority (LACDA), the Housing Authority of the City of Los Angeles (HACLA), the Housing Authority of the City of Baldwin Park, and the Housing Authority of the City of Lomita. The number of public housing units has remained stable over the past year.
Federal and State Subsidized Properties Are Concentrated in Low-Income Neighborhoods
Subsidized properties, including public housing sites, are unevenly distributed across Los Angeles County neighborhoods.14 In Watts, a low-income neighborhood in South Los Angeles, 44% of rental housing is located within a property linked to at least one federal or state subsidy or program – the highest share of any neighborhood in the county, followed by Chinatown (37%) and Santa Fe Springs (31%). The remaining neighborhoods in the top 10 are Downtown, Willowbrook, Commerce, Pacoima, Harbor City, Westlake, and Lancaster. About a fifth to a quarter of the rental housing stock in these neighborhoods is located in subsidized properties.
Neighborhoods with large shares of subsidized units have lower median incomes. The chart below shows the 10 neighborhoods with the largest share of subsidized properties. In 2024, the median household income in these neighborhoods ranged from $50,670 to $88,770, compared to the countywide median of $90,112. Among these 10 neighborhoods, Westlake has the lowest median household income, which is only 56% of the countywide median. Flip between the tabs in the figure below to see a map of subsidized units by neighborhood.

Historically, subsidized housing has been criticized for concentrating lower-income households in structurally disinvested, resource-limited neighborhoods, potentially reinforcing segregation and restricting access to higher-opportunity neighborhoods. In response, programs like LIHTC have begun to incentivize development in more affluent or opportunity-rich areas (Owens & Smith, 2023). About a third of the newly constructed LIHTC properties since 2021 are located in neighborhoods with median household income above the countywide median.
Housing Choice Vouchers (HCVs) are among the most commonly used demand-side affordable housing programs.
According to HUD’s Picture of Subsidized Households, the HCV program supported about 93,400 households in LA County in 2025, an increase of 1.8% from 2024. The total number of HCV households represents about 4.9% of all renter households in the county. For comparison, 6.7% of renter households in New York City are supported by the HCV program in 2025.
Vouchers help households maintain stable housing and potentially improve access to better-resourced communities. Although tenant-based vouchers are designed to expand households’ access to a broader range of neighborhoods, HCV use is geographically concentrated, much as subsidized housing units are. In 2025, 77% of Los Angeles County households (72,600) participating in the HCV program used tenant-based HCVs rather than project-based HCVs. Over half of the tenant-based voucher households live in only 23 neighborhoods (8.5%) of the county. Gramercy Park, Hyde Park, Manchester Square, Westmont, and Vermont Knolls have the highest concentration of tenant-based HCV households.
In the coming year, as the federal Emergency Housing Voucher (EHV) program comes to an end, the HCV program will help pick up the slack, preserving the housing stability of thousands of LA County families who currently use EHVs and who otherwise would be at risk of losing their homes. LACDA and HACLA have coordinated efforts to help more than 4,000 households transition from EHV to the HCV program, ensuring families can remain in their current homes (Housing Authority of the City of Los Angeles, 2026).
View housing choice vouchers by neighborhood on the NDSC map.
Permanent Housing for Houseless Angelenos Saw Its Largest Increase in a Decade
Alongside affordable housing subsidized by federal and state funding sources, Los Angeles County has made substantial investments in housing options over the past decade for the most disadvantaged segment of the population: people experiencing homelessness. In 2016, Los Angeles County voters passed Measure H, a tax measure that generated over $355 million annually for homeless services, prevention programs, and rental subsidies. In the same election, voters in the City of Los Angeles passed Proposition HHH to fund the development of housing set aside for people experiencing homelessness with high needs. Together, these initiatives have significantly expanded prevention efforts, service delivery, and housing options across the county. This section explores the availability of different types of permanent housing options for people experiencing homelessness since the passage of Measure H and Proposition HHH in 2016.
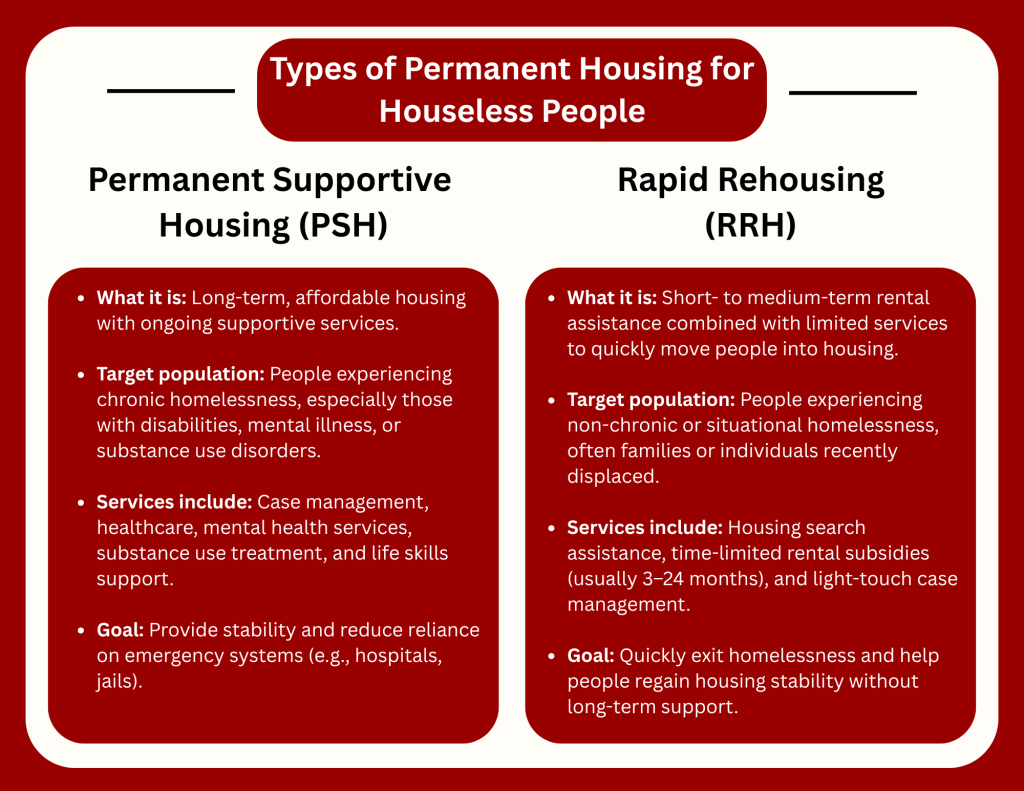
As of 2025, Los Angeles County15 had about 49,600 permanent beds available for people experiencing homelessness.16 Of these, over 34,800 (70%) are Permanent Supportive Housing (PSH), 12,900 (26%) are Rapid Rehousing (RRH), and 1,910 (4%) fall into other permanent housing categories. The current PSH inventory is split evenly between site-based and tenant-based beds. Site-based PSH provides beds and supportive services in specific buildings, often with many PSH residents. By contrast, tenant-based beds allow individuals to choose which neighborhood they would like to live in and to receive supportive services.
Since 2017, the number of PSH beds available in LA County has increased by 69% (from around 20,600 to 34,800). RRH beds quadrupled (from around 3,100 to 12,900) (see chart below). During the same period, however, the number of people experiencing homelessness increased by more than 15,000 (see Houseless Angelenos chapter), highlighting that the inflow of newly houseless individuals far exceeds the number that are being moved into RRH or PSH units.

The pace of increase in PSH unit availability has picked up in the most recent period: Between 2024 and 2025, the county added nearly 5,700 PSH beds, a 20% increase over a year, and the largest single-year expansion in the past decade. RRH capacity grew as well, rising from about 9,700 to 12,850 beds over the same year, an increase of more than 3,100 beds, or roughly 32%. In 2025, the number of RRH beds reached its highest level in the past decade, exceeding the previous peak set in 2022. However, Other Permanent Housing (OPH) beds declined from about 2,190 to 1,910 between 2024 and 2025, continuing a downward drift since their 2018 peak of over 3,300. Unlike PSH, OPH offers residents less extensive supportive services.
Contributors
- Authors
- Jiaqi Dong, USC Lusk Center for Real Estate
- Cameron Yap, USC Lusk Center for Real Estate
- Jared N. Schachner, USC Price School of Public Policy
- Research Team
- Elizabeth Grubb, USC Lusk Center for Real Estate
- Adela G Ortiz, USC Lusk Center for Real Estate
- Christine Steinmann, USC Lusk Center for Real Estate
- Evan Sandlin, LABarometer
- Kyla Thomas, LABarometer
Citations
Baker Botts. (2026, March 20). The Senate’s 21st Century ROAD to Housing Act: Key implications for commercial real estate. Link
Baum-Snow, N., & Han, L. (2024). The microgeography of housing supply. Journal of Political Economy 132.6 (2024): 1897-1946.
California Department of Housing and Community Development. (2021). Southern California Association of Governments Regional Housing Need Determination. California Department of Housing and Community Development. Link
Construction Coverage. (2025). U.S. Cities Building the Most New Housing [2025 Edition]. ConstructionCoverage.com. Link
Cressy, M. A. (2024). ADUs in CD3: A broad analysis of the prevalence, role, and impact of accessory dwelling units in Los Angeles’ Council District 3 (Master’s capstone, University of California, Los Angeles). eScholarship. Link
Friberg, M. (2026, March 17). LA wildfires recovery: What the permit record shows. Shovels. Link
Gyourko, J., & Krimmel, J. (2021). The impact of local residential land use restrictions on land values across and within single family housing markets. Journal of Urban Economics 126 (2021): 103374.
Housing Authority of the City of Los Angeles. (2026). More than Four Thousand Families Assisted by the Emergency Housing Voucher Program to Remain Housed Through Coordinated City and County Efforts. Link
Kneebone, E., & Reid, C. (2021). The Complexity of Financing Low-Income Housing Tax Credit Housing in the United States. Terner Center for Housing Innovation. Link
Kim, A. M., & Eisenlohr, A. (2022). Community Land Trusts for Sustainably Affordable Rental Housing Redevelopment: A Case Study of Rolland Curtis Gardens in Los Angeles. Cityscape (Washington, D.C.), 24(1), 233–256.
Los Angeles County Affordable Housing Solutions Agency. (2026). LACAHSA FY 2025-26 Expenditure Plan & Agency Strategy. Link
National Association of Home Builders. (2026, March 27). Aging housing stock keeps demolition activity elevated. Link
New York University Furman Center for Real Estate and Urban Policy. (n.d.). CoreData.nyc. Link
Owens, A., & Smith, R. B. (2023). Producing affordable housing in higher-opportunity neighborhoods: Incentives in California’s LIHTC program. Journal of Urban Affairs, 1–29. Link
Reina, V., & Williams, M. (2012). The Importance of Using Layered Data To Analyze Housing: The Case of the Subsidized Housing Information Project. Cityscape (Washington, D.C.), 14(1), 215–222.
Southern California Association of Governments. (2021). SCAG 6TH CYCLE FINAL RHNA ALLOCATION PLAN. Link
Footnotes
- Age refers to when the building was first constructed, not when it was remodeled, added to, or converted. Housing units built prior to 1939 are coded simply as “1939.” As a result, this measure is most useful for analyzing new housing construction over the past 85 years, rather than distinguishing among housing built in earlier periods (e.g., 1800s). Median age is calculated by subtracting the median year built from 2024.
- The accuracy of this data depends on what each jurisdiction reports. The California Department of Housing and Community Development (HCD) does not systematically verify these submissions, and smaller cities may have limited capacity or resources to track and report data consistently.
- This includes all households making less than half of area median income, encompassing both Extremely Low Income (ELI) and Very Low Income (VLI) households (e.g., in 2024, for a household in Los Angeles County with three people, the household income limit is below $62,400 to be considered Very Low Income).
- Low Income (LI) households are those making between 50% to 80% of Area Median Income (e.g., in 2024, for a household in Los Angeles County with three people, the household income limit is between $62,400 and $99,900).
- Last year’s SOLACHAN 2025 report referenced HCD data which stated 49% of new units in LA County in 2022 were ADUs. Since last year’s report, the data provided by HCD has been corrected to state that 29% of new units in LA County in 2022 were ADUs. Data reported to HCD is self-reported by jurisdictions, and jurisdictions may submit revisions to their annual progress report at any time.
- Above Moderate Income (ABMI) households are those making more than 120% of the LA County area median income (e.g., for a household with 3 people, the household income is $106,050 or more in 2024).
- For reference, according to the ACS 2024 1-year estimates, City of Los Angeles households make up 42% of the households in the county (1,480,869 out of 3,485,810 households).
- The 6th RHNA Cycle spans from October 2021 to October 2029. This visualization includes data for the full calendar year of 2021 and should be interpreted as an estimate of progress toward each jurisdiction’s housing goals, not an exact or official measure.
- This analysis includes properties listed in the City of Los Angeles Housing Element APR that received a building permit between 2018 and 2022. This timeframe enables us to monitor the majority of projects through to completion (from building permit issuance to receipt of Certificate of Occupancy), as most projects permitted as late as December 2022 are expected to have obtained a certificate of occupancy by December 2025 (our last month of available data). For further details on methodology, refer to the Data & Methods appendix.
- Some of the properties can contain a few units for property managers. These units are not considered assisted.
- 2024 ACS 1-year estimates, sum of renter occupied units, units vacant for rent and vacant units rented but not yet occupied.
- Some of these properties and homes may be subsidized by other city programs, such as 421-a and 420-c tax exemptions, or other inclusionary zoning programs. It is important to note that New York City has the largest public housing stock in the nation, accounting for approximately 8% of its total rental housing units.
- Including several developments that are under construction but not yet placed in service. For more information regarding the LIHTC program, please visit here.
- Analysis is limited to neighborhoods with more than 1,000 rental units.
- There are four Continuums of Care (CoCs) in Los Angeles County: the Los Angeles County CoC (LA CoC), which covers all areas except for three cities that operate their own CoCs: Glendale, Pasadena, and Long Beach. Each CoC is a regional planning body recognized by the U.S. Department of Housing and Urban Development (HUD) that coordinates housing and services funding for people experiencing homelessness within its jurisdiction.
- Some of the PSH and RRH beds overlap with the federally and state subsidized property universe in the earlier part of the chapter. However, further insights into the neighborhood distribution or funding stream analysis of the beds are limited because about half of the addresses in the HIC data are invalid addresses. For more details, please refer to the methodology section.